
US Stock Market Key Points:The S&P 500, Dow and Nasdaq 100 sink to fresh monthly lowsBetter-than-expected economic data fuels the perception that
US Stock Market Key Points:
- The S&P 500, Dow and Nasdaq 100 sink to fresh monthly lows
- Better-than-expected economic data fuels the perception that FOMC has more room to raise interest rates
- All eyes on NFP data on Friday and European inflation figures on Thursday’s economic calendar.
Most Read:Dow Jones Short-term Technical Outlook: Stock Plunge Searches Support
US equity markets started the day in an upbeat mood after yesterday’s hold of support, following last Friday’s Powell speech in Jackson Hole. But good news for the economy turned into bad news for stocks. Today’s Economic Calendar included August’s Consumer Confidence and the July JOLTS employment report. Both surveys came in better-than-expected, which dampened demand for risk assets. Favorable economic conditions are seen as an indication that the FED will not steer away from its aggressive tightening cycle as the Central Bank addresses the demand side of the economy.
At the close, the Dow and the S&P 500 fell 0.96% and 1.10% respectively. The Sector dragging down the decline was Energy. Yesterday I mentioned that oil was supported by the prospect of supply cuts by OPEC+ on the possibility of a Nuclear Deal being reached with Iran, but today investors were focused on the effects of rising interest rates. During the Jackson Hole Economic Symposium, not only did the FED highlight the need of more rate hikes, but ECB members also opened the possibility of aggressive tightening to curb inflation at their September 8th meeting. Rising interest rates would ultimately dent consumer demand and, in-turn, light crude oil prices fell today below the 200 Day Moving Average. The WTI contract for October is around $91.7p/b, as of this writing.
WTI Daily Price Chart
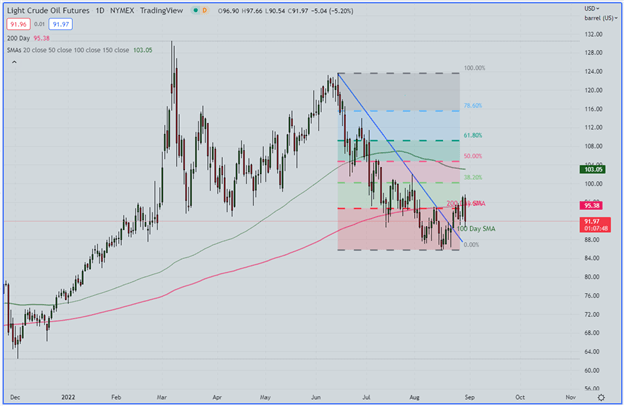
Light Crude Oil Daily Price Chart Preapred Using TradingView
Also, in-line with expectations of rising interest rates, growth stocks continued to fall today. The Nasdaq100 finished 1.13% lower. News that Baidu -a Chinese technology company- announced lower year-over-year revenue, added to the movement. The Index now trades below the 100 Day Simple Moving Average. Deeper support potential on the index resides around the 23.6% Fibonacci retracement at 12,060.
Nasdaq100 Daily Chart
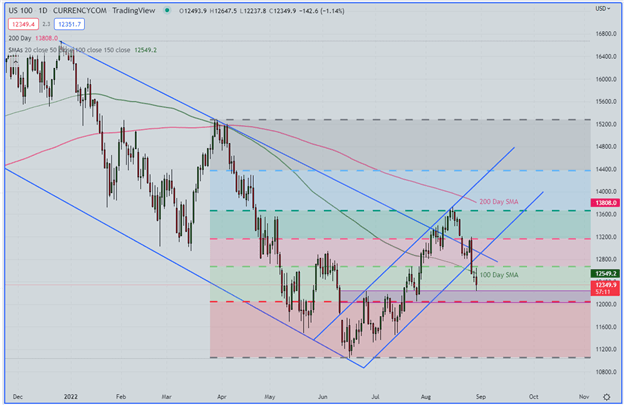
Nasdaq 100 Daily Chart Prepared Using TradingView
Likewise, it is worth noting that the pace of the USD strength has softened in recent days despite the higher rate expectations. The US dollar (DXY) index is currently trading within an important monthly resistance zone. Given the fundamental circumstances, positioning could likely be the biggest challenge for further strength as EUR/USD gyrates around the parity psychological level.
USD Index (DXY)Monthly Chart
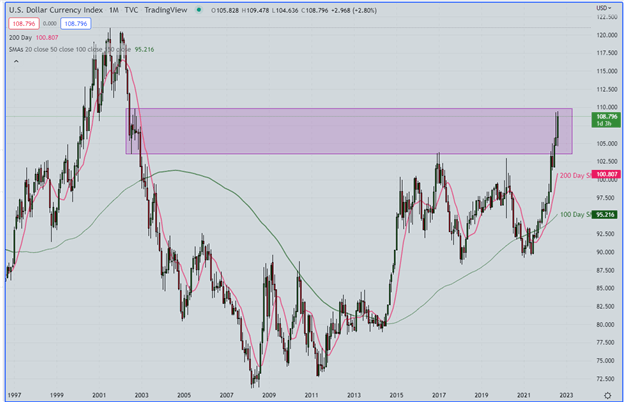
USD Index (DXY) Monthly Chart Preapred Using TradingView
Regarding EUR/USD, the pair may be in the process of finding support, helped by lower energy prices and the possibility of more-aggressive tightening by the European Central Bank.
EUR/USD Daily Chart
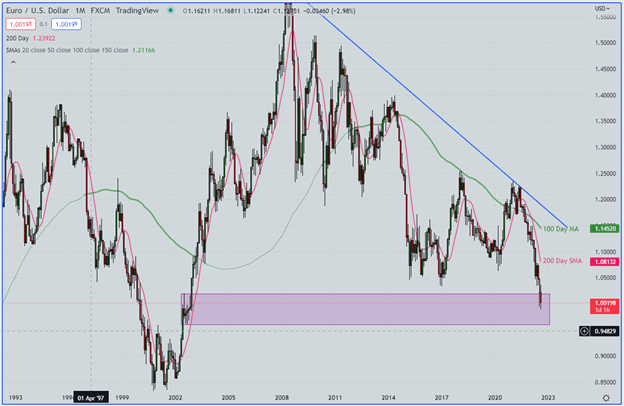
EUR/USD Daily Chart Prepared Using TradingView
EDUCATION TOOLS FOR TRADERS
- Are you just getting started? Download the beginners’ guide for FX traders
- Would you like to know more about your trading personality? Take the DailyFX quiz and find out
- IG’s client positioning data provides valuable information on market sentiment. Get your free guide on how to use this powerful trading indicator here.
—Written by Cecilia Sanchez-Corona, Research Team, DailyFX
element inside the
element. This is probably not what you meant to do!Load your application’s JavaScript bundle inside the element instead.
www.dailyfx.com