USD, US DOLLAR, DXY INDEX - Outlook:Market diversity appears to be running low in the DXY Index, suggesting overcrowding.Having said that, US except
USD, US DOLLAR, DXY INDEX – Outlook:
- Market diversity appears to be running low in the DXY Index, suggesting overcrowding.
- Having said that, US exceptionalism is still intact.
- What is the outlook on the greenback and the signposts to watch?
If you’re puzzled by trading losses, why not take a step in the right direction? Download our guide, “Traits of Successful Traders,” and gain valuable insights to steer clear of common pitfalls that can lead to costly errors.
Recommended by Manish Jaradi
Traits of Successful Traders
The US dollar’s rally is looking stretched on some measures, including market diversity, on the growing conviction that the US interest rates have pivoted.
Key US Federal Reserve officials sounded less hawkish last week, indicating that the jump in US Treasury yields has done some of the Fed’s tightening for it and proceeding carefully with any further increases in the benchmark federal funds rate. As a result, the market-implied pricing for the US terminal rate has fallen sharply. Markets will now be looking for a confirmation from Fed Chair Jerome Powell later this week if the US central bank has indeed pivoted.
Minutes of the last FOMC meeting showed increased concern about the risks of hiking too much, though members agree that there is still work to do with key measures of inflation remaining well above their target. Moreover, the conflict in the Middle East lowers the bar for immediate tightening. The market is pricing in around a 90% chance that the Fed will keep interest rates unchanged at its Oct. 31-Nov. 1 meeting.
DXY Index Index Chart

Chart Created by Manish Jaradi Using TradingView
Interestingly, market diversity, as measured by fractal dimensions, appears to be low as the DXY Index hit a multi-month high last month. Fractal dimensions measure the distribution of diversity. When the measure hits the lower bound, typically 1.25-1.30 depending on the market, it indicates extremely low diversity as market participants bet in the same direction, raising the odds of at least a pause or even a price reversal. For the DXY Index, the 65-day fractal dimension has fallen below the threshold of 1.25, flashing a red flag. See the chart with previous instances when the indicator fell below the 1.25 threshold.
DXY Index Weekly Chart

Chart Created by Manish Jaradi Using TradingView
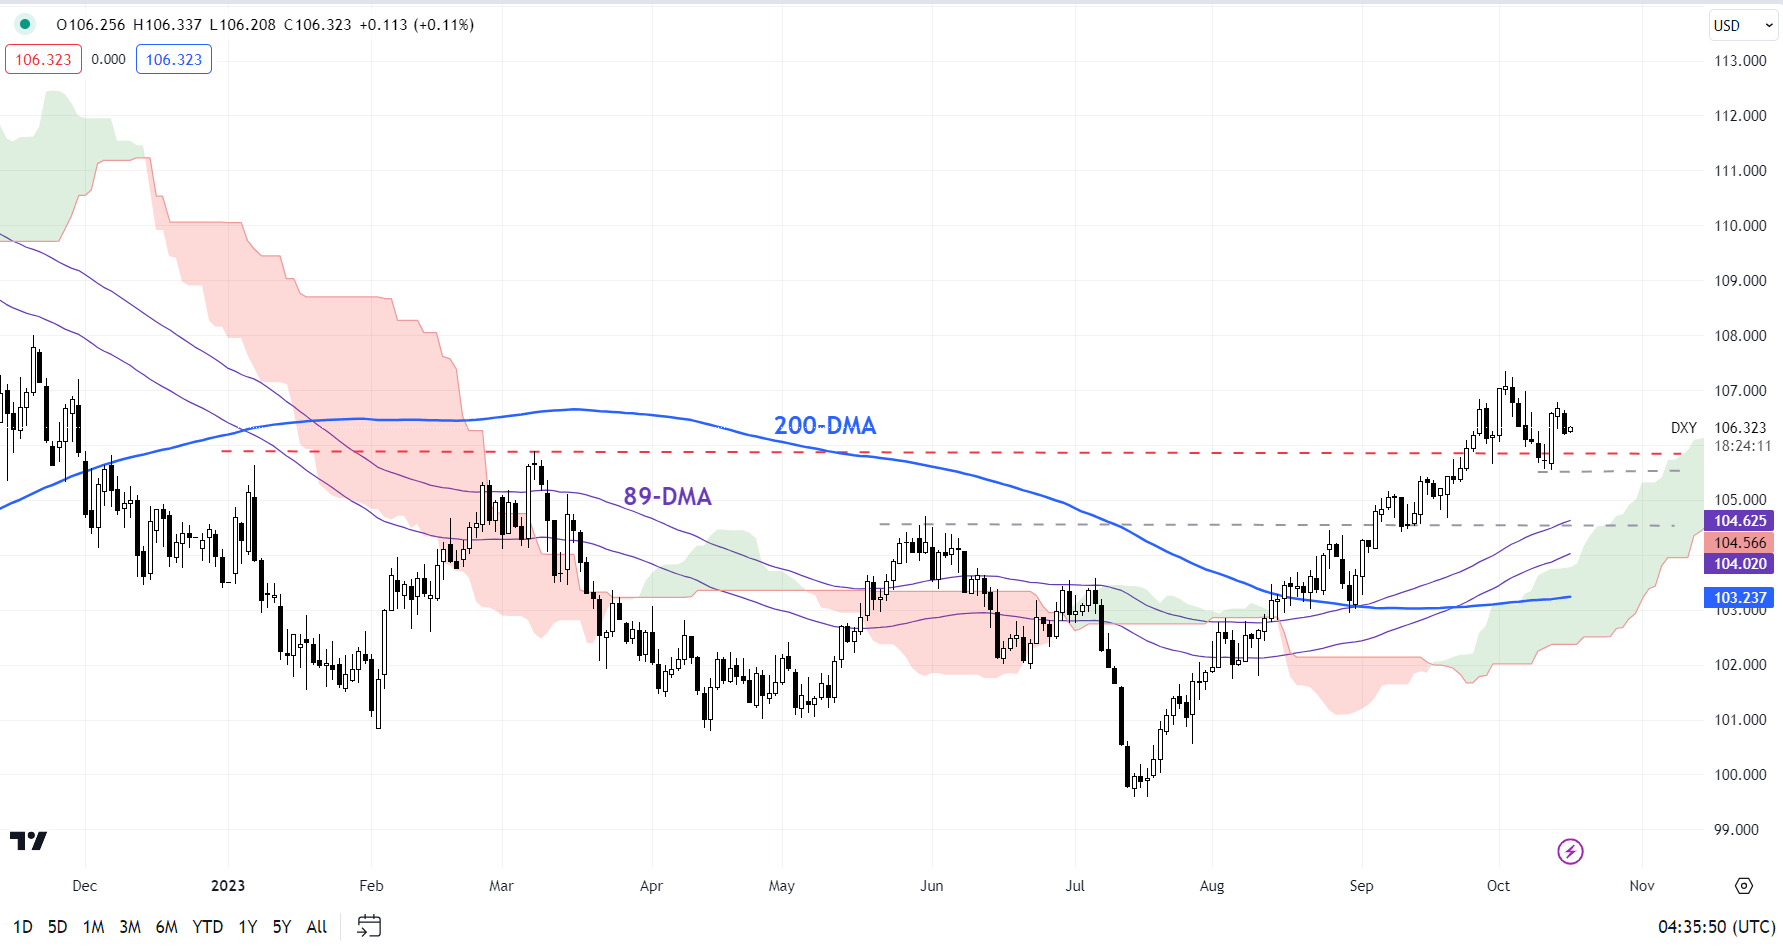
On technical charts, the index is testing major resistance on the upper edge of the Ichimoku cloud on the daily charts, near the March high of 105.90. However, for the immediate upward pressure to fade, the index would need to fall below initial support at last week’s low of 105.50.
DXY Index Daily Chart

Chart Created by Manish Jaradi Using TradingView
Beyond the short term, the outperformance of the US economy relative to the rest of the world coupled with a relatively hawkish Fed compared with its peers have been key drivers for the USD. Jobs data earlier this month highlighted that the US economy remains on a solid footing. Unless US exceptionalism reverses, the US dollar could stay well bid even if there is convergence of monetary policy.
Looking for actionable trading ideas? Download our top trading opportunities guide packed with insightful tips for the fourth quarter!
Recommended by Manish Jaradi
Get Your Free Top Trading Opportunities Forecast
— Written by Manish Jaradi, Strategist for DailyFX.com
— Contact and follow Jaradi on Twitter: @JaradiManish
element inside the
element. This is probably not what you meant to do!Load your application’s JavaScript bundle inside the element instead.
www.dailyfx.com

COMMENTS