
Japanese Yen, USD/JPY, US Dollar, BOJ, Fed, YCC, Yields - Talking PointsUSD/JPY has continued to rally in tandem with Treasury yieldsThe Bank of Japan
Japanese Yen, USD/JPY, US Dollar, BOJ, Fed, YCC, Yields – Talking Points
- USD/JPY has continued to rally in tandem with Treasury yields
- The Bank of Japan have the market spooked on intervention concerns
- If monetary policies continue to diverge, will USD/JPY make new highs?
Recommended by Daniel McCarthy
Get Your Free JPY Forecast
The Japanese Yen is languishing near 32-year lows seen last Friday as the market weighs up the prospect of the Bank of Japan (BoJ) intervening again.
It is almost a month since Japanese authorities sold USD/JPY to provide some price stability for the currency. At the that time the high had been 145. 90 and it is now trading above 148 as the market eyes off the psychologically significant level at 150.
There has already been some jawboning to start the week with Japan’s Vice Finance Minister for International Affairs Masato Kanda saying that each country would respond appropriately and firmly to excessive currency moves.
Finance Minister Shunichi Suzuki also chimed in with comments that authorities would act decisively against excessive currency fluctuations. These remarks have traders cautious to start the week.
Official intervention is usually more successful when underlying fundamental circumstances support such meddling in markets. The BoJ have stipulated that they will maintain ultra-loose monetary going forward at the same that the Federal Reserve are signalling that jumbo hikes are coming down the pipe for their target rate.
The BoJ have a policy rate of -0.10% and are maintaining yield curve control (YCC) by targeting a band of +/- 0.25% around zero for Japanese Government Bonds (JGBs) out to 10-years.
The Fed on the other hand is looking as hawkish as ever after US CPI came in hotter than anticipated last Thursday.
The disparity of policy can be clearly seen looking at 10-year Treasury yields and the spread between Treasuries and JGB’s. The correlation with USD/JPY is apparent.
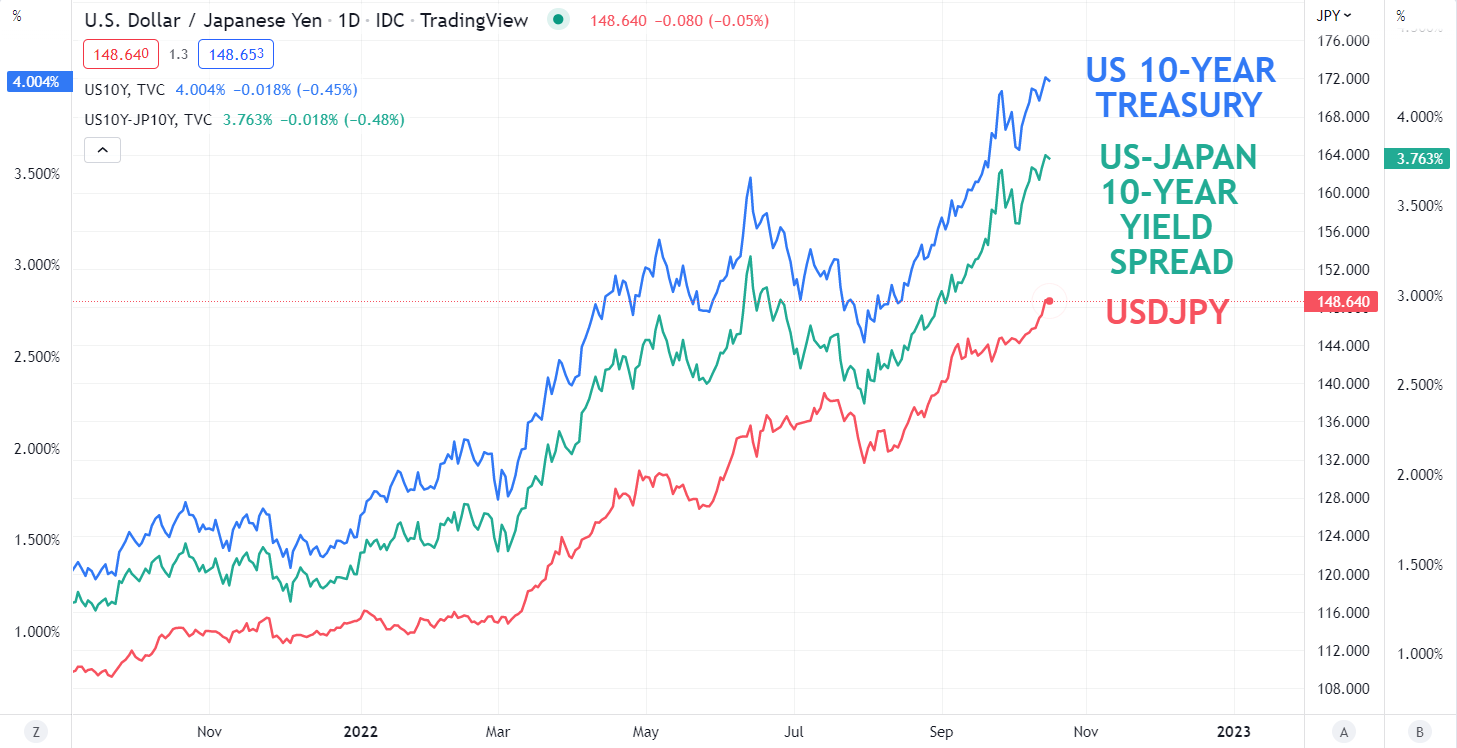
Chart created in TradingView
USD/JPY TECHNICAL ANALYSIS
USD/JPY made a 32-year high last week as it bumped against the upper band of an ascending trend channel when it made a new peak at 148. 86.
That level and the 161.8% Fibonacci Extension of the move from 145.90 down to 140.35 may offer resistance at 149.35.
Bullish momentum appears to be intact with the price trading above all period Simple Moving Averages (SMA) and all of those SMAs have a positive gradient.
A near term potential indicator of bullish momentum fading could be a snap below the 10-day SMA, currently at 146.21.
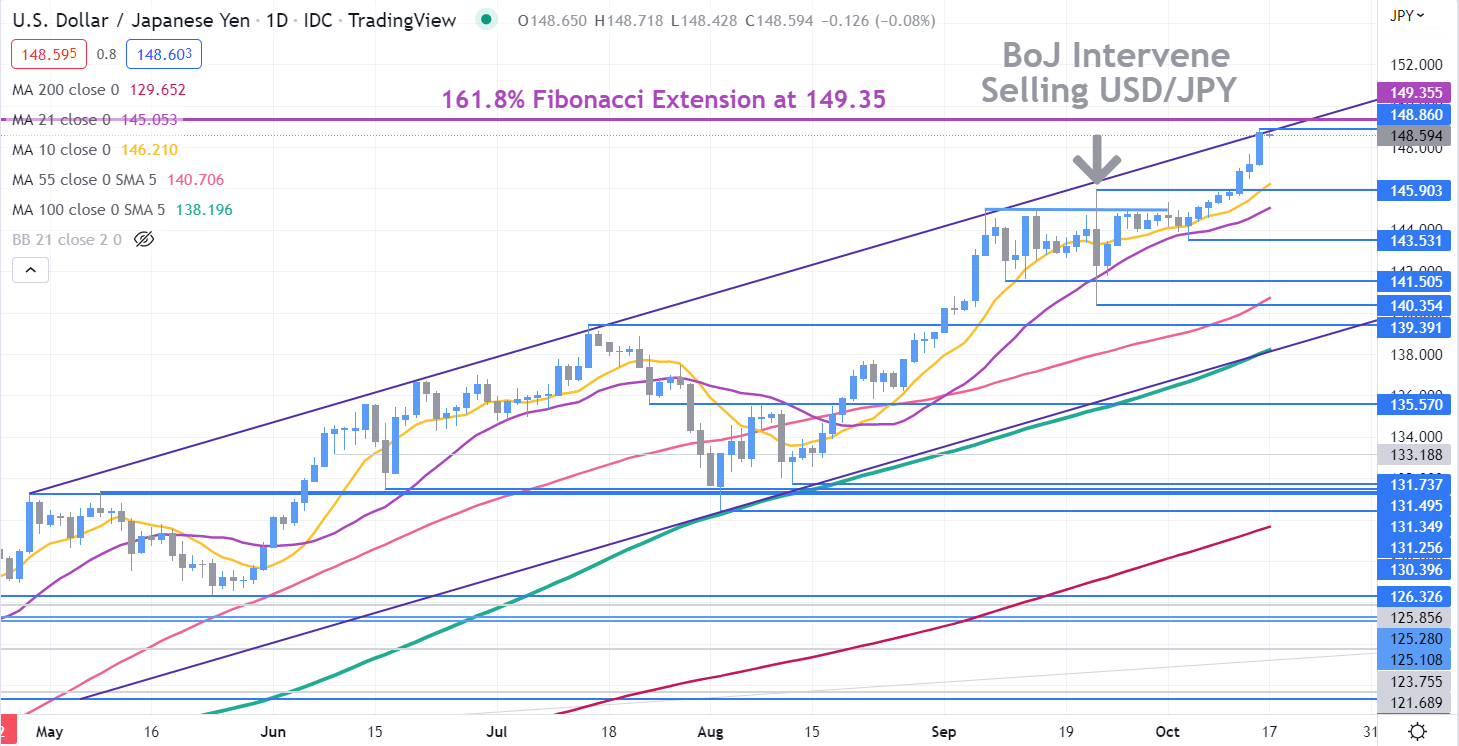
Chart created in TradingView
Recommended by Daniel McCarthy
How to Trade USD/JPY
— Written by Daniel McCarthy, Strategist for DailyFX.com
To contact Daniel, use the comments section below or @DanMcCathyFX on Twitter
element inside the
element. This is probably not what you meant to do!Load your application’s JavaScript bundle inside the element instead.
www.dailyfx.com