
Japanese Yen, USD/JPY, US Dollar, CHF/JPY, Swiss Franc - Talking PointsUSD/JPY made 20-year high last week within an ascending trend CHF/JPY has cons
Japanese Yen, USD/JPY, US Dollar, CHF/JPY, Swiss Franc – Talking Points
- USD/JPY made 20-year high last week within an ascending trend
- CHF/JPY has consolidated recently but another big move might happen
- A lower JPY could be inevitable. How much further can the Yen weaken?
USD/JPY
USD/JPY is within an ascending trend channel that started in early March.
The run higher has seen it make 20-year highs, with last week’s peak of 131.26 a potential resistance level. Above there, the early 2020 highs of 135.01 and 135.16 could offer resistance.
Support may lie at the pivot points of 129.41, 125.68, 125.28 and 125.11. Just below the latter is the 34-day simple moving averages (SMA), which could add support. The most recent low of 127.025 may provide support.
The last few sessions have seen the price action move mostly sideways, but it remains above all daily SMAs across all time periods. This could indicate bullish momentum may continue to evolve.
A move below the 5-day SMA could see momentum pause, but it would a move below several SMAs to confirm a turn in momentum.
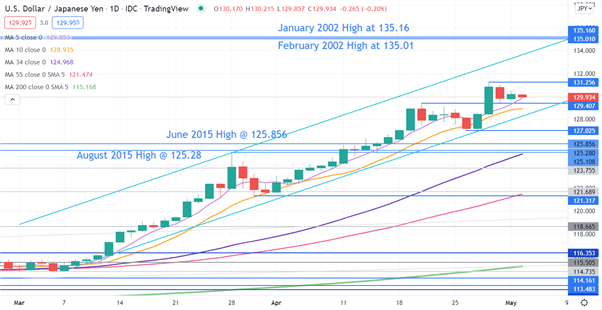
Chart created in TradingView
CHF/JPY
CHF/JPY has historically exhibited periods of range trading, which is not surprising given the similar underlying fundamental characteristics. A break-out of the range has previously seen a run to new levels before a new range is established.
It’s possible that the recent run higher has paused, and it might be establishing a new range of 131.95 – 136.18, the low and high of the last month. These levels may provide support and resistance respectively.
Further support might lie at the 34-day simple moving average (SMA), currently at 132.55 or a prior low of 130.77 and a pivot point of 129.03. The latter was the August 2015 peak.
On the topside, resistance could be at the previous peaks of 134.62, 135.05 and 135.43.
The short-term 10-day SMA has just crossed below the 21-day SMA, which may signal that near term bearish momentum could unfold.
The 34- and 55-day SMAs are below the price and have positive gradients, suggesting that underlying bullish momentum remains. This clash of momentum signals might be indicative of a range trading environment for now.
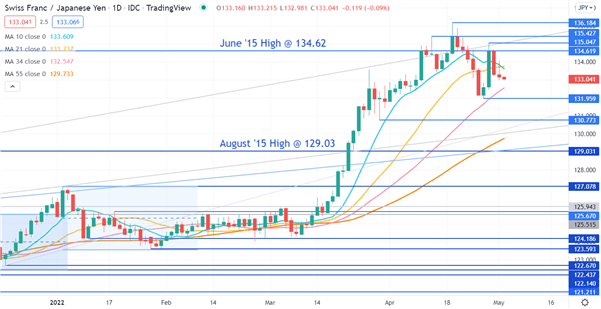
Chart created in TradingView
— Written by Daniel McCarthy, Strategist for DailyFX.com
To contact Daniel, use the comments section below or @DanMcCathyFX on Twitter
element inside the
element. This is probably not what you meant to do!Load your application’s JavaScript bundle inside the element instead.
www.dailyfx.com