Article by IG Chief Market Analyst Chris BeauchampNasdaq 100, Nikkei 225, S&P 500 Analysis and ChartsNasdaq 100 holds key supportThe index ra
Article by IG Chief Market Analyst Chris Beauchamp
Nasdaq 100, Nikkei 225, S&P 500 Analysis and Charts
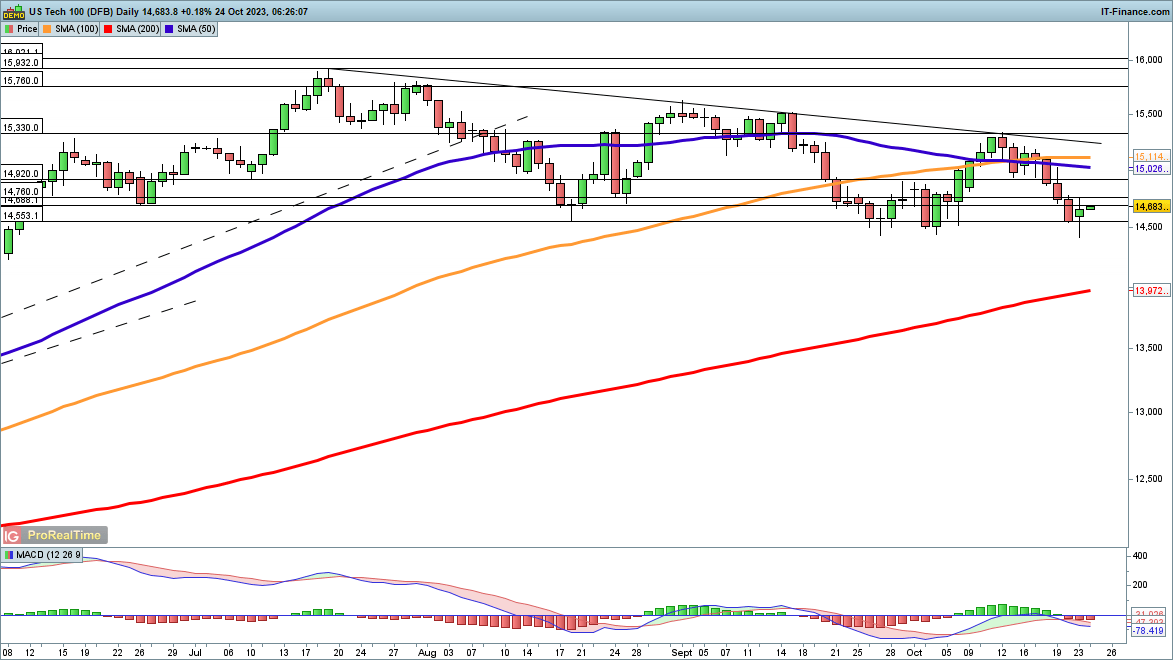
Nasdaq 100 holds key support
The index rallied off the 14,500 level for the second time in a month, in an echo of September’s price action.Now the bulls need to get the price back above 14,800 on a closing basis – Monday’s price action witnessed a push to this level, but momentum then faded.
For the moment, the bearish case is still in the ascendant in the short-term, but a bigger pullback will require a close below 14,400, putting the price below the lows of the past month.
Nasdaq 100 Daily Chart

Recommended by IG
Get Your Free Top Trading Opportunities Forecast
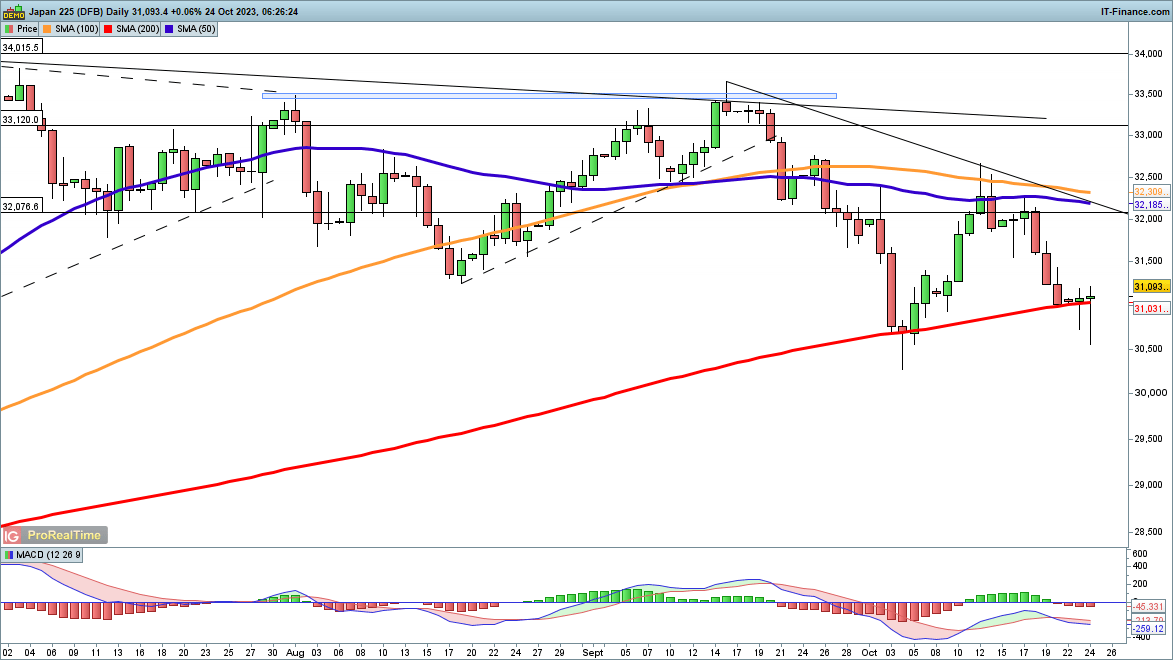
Nikkei 225 stays above 200-day MA
Once more the 200-day SMA appears to be acting to stem losses, with a push below this indicator finding buyers on Monday and Tuesday.Now the buyers must push on, with a close above 31,300 helping to solidify a low and allowing a move back towards the 32,500 level to be contemplated.
A close back below 30,700 would suggest that the 200-day SMA has been breached and a near-term bearish view prevails.
Nikkei225 Daily Chart

| Change in | Longs | Shorts | OI |
| Daily | 10% | -3% | 4% |
| Weekly | 26% | -24% | 1% |
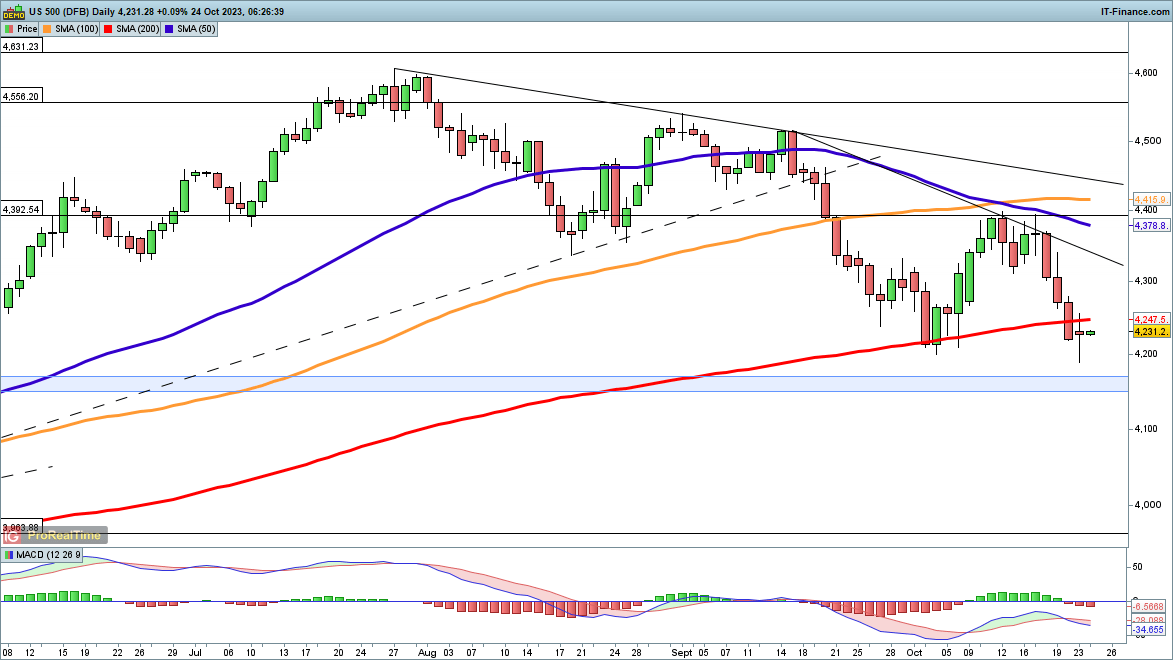
S&P 500 holds September lows
The index was unable to get back above the 200-day SMA on Monday, but for the moment the 4200 lows from September continue to hold.In the event of further downside, the 4160 area, which marked the highs from February and March, would come into view. Below this, the 4070 might be the next area of support.
A close back above the 200-day SMA might yet provide hope thata low has formed, which could then see the price test short-term trendline resistance from the early September high.
S&P 500 Daily Chart

element inside the
element. This is probably not what you meant to do!Load your application’s JavaScript bundle inside the element instead.
www.dailyfx.com

COMMENTS