
Crude Oil Technical Forecast: WTI Weekly Trade LevelsCrude Oilupdated technical trade levels – Weekly ChartWTI price correction griding into support-
Crude Oil Technical Forecast: WTI Weekly Trade Levels
- Crude Oilupdated technical trade levels – Weekly Chart
- WTI price correction griding into support- risk for further losses within broader uptrend
- New to Oil Trading? Get started with this Free How to Trade Oil-Beginners Guide
Oil prices plunged more than 27% off the yearly high with WTI still on the retreat from the March rally. The technical stance leaves room for further losses near-term and we’re on the lookout for an exhaustion low in the weeks ahead. These are the updated targets and invalidation levels that matter on the oil price weekly chart. Review my latest Strategy Webinar for an in-depth breakdown of this crude oil price technical setup and more.
Crude Oil Price Chart
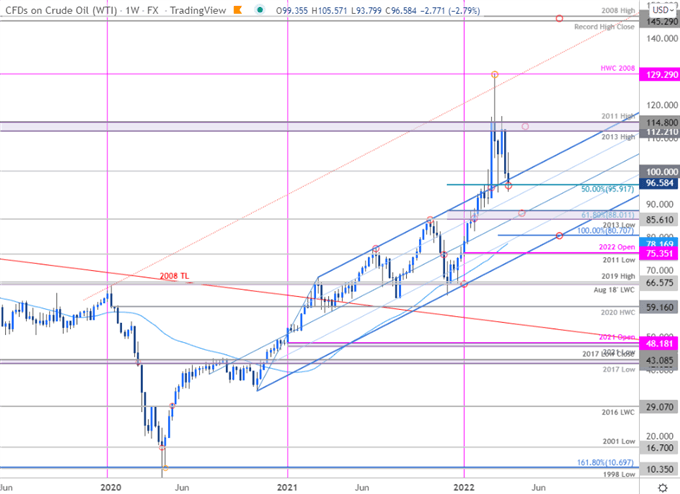
Chart Prepared by Michael Boutros, Technical Strategist; Crude Oil (WTI) on Tradingview
Notes:In my last Crude Oil Technical Forecast we noted that the WTI, “price breakout has exhausted into the first lateral level of resistance and a close below 114.80 highlights the risk for further weakness.” Since then, oil prices have been in a massive range just below resistance at the 2013 / 2011 highs at 112.21-114.80 with last week marking the largest weekly loss since April 2020 (right before price went negative). Other instances can be seen just a few weeks ahead of the 2018 lows, ahead of the 2016 lows and a few months ahead of the January 2015 lows- the parallels suggest a few more weeks of volatility here but generally, we’re on the lookout for a low.
Initial support rests here at the confluence of former slope resistance / 50% retracement of the late 2021-advance at 95.91. More significant support rest at the 2013 low / 61.8% Fibonacci retracement at 85.61-88.01 – even if this is a simple correction (two-equal legs off the highs), a dip towards 80.70 would still keep the broader uptrend viable. Key resistance steady at 112.21-114.80 – a breach / weekly close above is needed to mark resumption back towards the 2008 high-week close / yearly highs at 129.29/41.
Bottom line: The oil prices are searching for a low on this pullback and while the broader outlook remains constructive, near-term the threat is for a deeper flush-out here. From a trading standpoint, 88 & 80.740 are both areas of interest for possible downside exhaustion IF reached with a weekly close above 114.80 ultimately needed to mar resumption.
For a complete breakdown of Michael’s trading strategy, review his Foundations of Technical Analysis series on Building a Trading Strategy
Crude Oil Trader Sentiment – WTI Price Chart
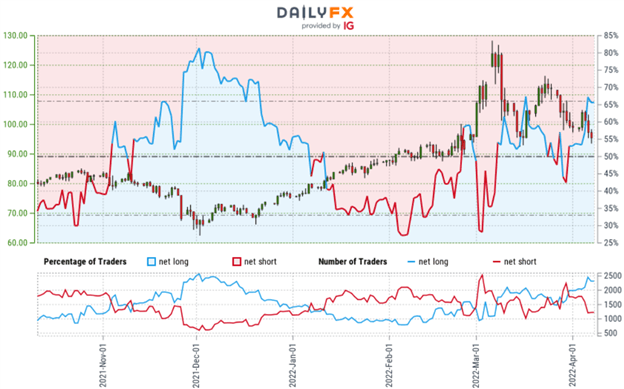
- A summary of IG Client Sentiment shows traders are net-long crude oil – the ratio stands at +1.93 (65.91% of traders are long) – typically bearishreading
- Long positions are2.37% lower than yesterday and 20.36% higher from last week
- Short positions are1.95% lower than yesterday and 33.77% lower from last week
- We typically take a contrarian view to crowd sentiment, and the fact traders are net-long suggests Oil – US Crude prices may continue to fall. Traders are less net-long than yesterday but more net-long from last week. The combination of current positioning and recent changes gives us a further mixed Oil – US Crude trading bias from a sentiment standpoint.
—
Previous Weekly Technical Charts
— Written by Michael Boutros, Technical Strategist with DailyFX
Follow Michael on Twitter @MBForex
element inside the
element. This is probably not what you meant to do!Load your application’s JavaScript bundle inside the element instead.
www.dailyfx.com