
Looking into the opening quarter of 2022, there seems a high threshold for exuberance. That descriptor of sentiment ('exuberance') should relay th
Looking into the opening quarter of 2022, there seems a high threshold for exuberance. That descriptor of sentiment (‘exuberance’) should relay the difficulty of sustaining the charge that speculative markets have enjoyed post-pandemic – or more generally since the beginning of the bull trend dating back to 1Q 2009 (after the Great Financial Crisis). I’m not predicting a full-scale risk aversion, rather I acknowledge that a slump in sentiment would be far more productive than a sustained advance. There are options for a chop higher by throwing in with momentum favorites or seeking out measures trading at a discount for another leg of tepid risk appetite. That said, the breadth of enthusiasm through the fourth quarter of 2021 was noticeably less comprehensive than what we have seen in previous quarters. Among those benchmarks that I believe to be stretched and prone to retreat is USDJPY.
Chart of USD/JPY (Weekly)
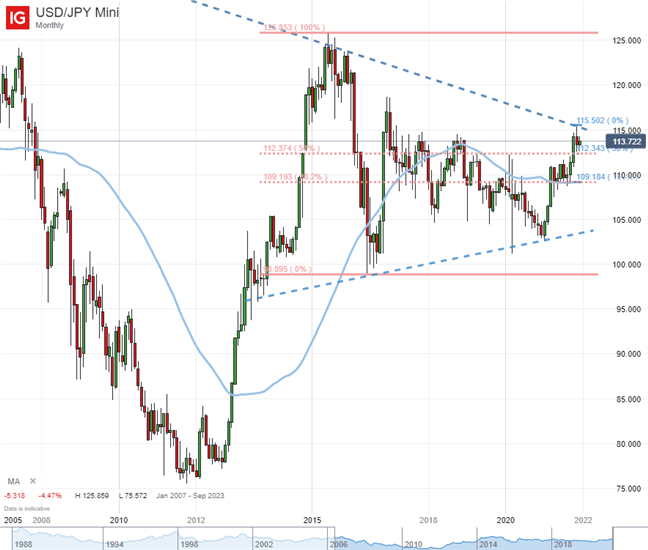
Chart prepared by John Kicklighter, created with IG Platform
The Dollar has enjoyed a rally founded on a swell in US rate forecasts, but three full hikes through the coming year seems the peak of hawkish enthusiasm short of addressing a serious fundamental problem. While I acknowledge there is potential for USDJPY to rise to four year highs above 115.00, I believe a break below 112.25 would be more productive. Technically, that floor is the ‘neckline’ of a head-and-shoulders pattern as well as the confluence of various technically-derived support measures (eg overlapping Fibonacci levels).
Chart of USD/JPY (Daily)
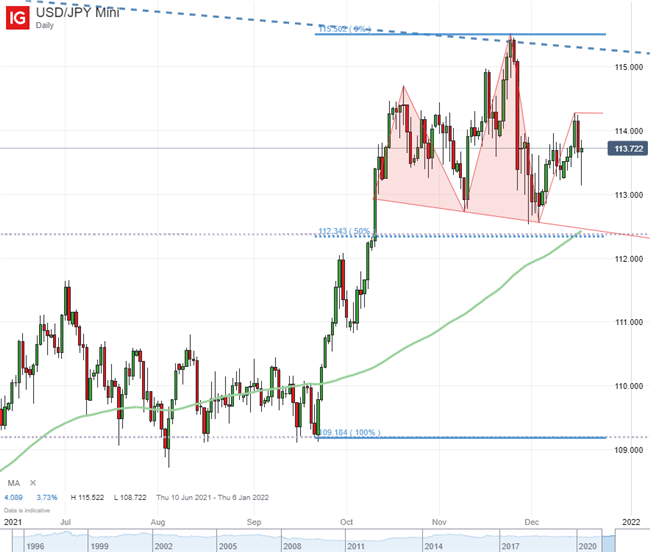
Chart prepared by John Kicklighter, created with IG Platform
In FX, everything is relative; and there is something to that perspective that investors would benefit appreciating. When we look at gold or crude oil for example, we are considering the commodity price against the value of the US Dollar. All of that said, I think one of the more remarkable measures of investor indulgence can be found among the US indices themselves. In general for the major US stock indices, there is a very strong correlation. However, when we compare their performance, certain preferences can show through that may signal a stretched speculative position. In particular, these past few years we seem to have seen a bid for assets that exhibit more momentum than tangible value. I have been particularly impressed – or concerned depending on the day you ask me – by the surge in the ratio of the Nasdaq 100 relative to the Dow Jones Industrial Average.
Chart of Nasdaq 100 to Dow Jones Industrial Average Ratio with 100-Day SMA (Daily)
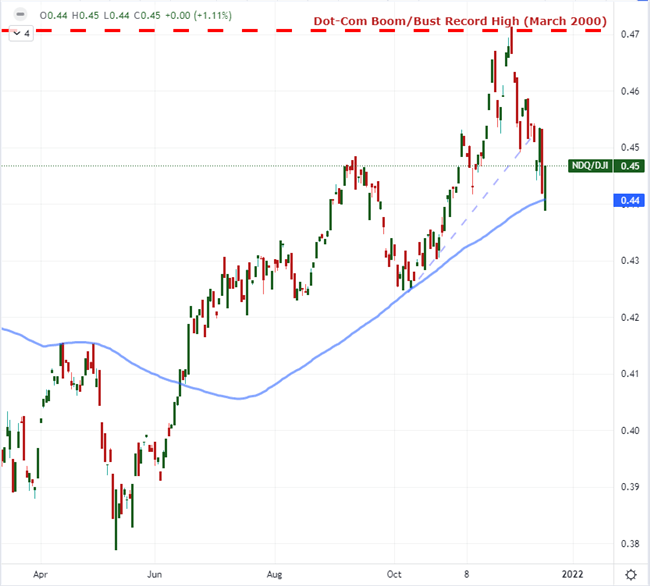
Chart prepared by John Kicklighter with TradingView Charts
The former tech-heavy index is often considered a ‘growth’ benchmark while the later blue-chip more frequently receives the moniker of a ‘value’ index. Notably, this past quarter the ratio briefly overtook the previous record high set back in March 2000 – a turning point which is now considered the breaking point of the Dot-Com bubble. It would be unreasonably symbolic to see a straight reversal after tagging that level, but greater scrutiny is likely to gain traction. Alternatively, an outright risk aversion would likely see an aggressive drop in this ratio.
element inside the
element. This is probably not what you meant to do!Load your application’s JavaScript bundle inside the element instead.
www.dailyfx.com