Commodity dollars have been under pressure for around two months, as the USD has turned bullish on a less-dovish FED, as they refuse to call it quits
Commodity dollars have been under pressure for around two months, as the USD has turned bullish on a less-dovish FED, as they refuse to call it quits with rate hikes, despite markets not expecting any more hikes. The USD gained strength due to more robust economic data and indicators, which attracted investors seeking a safe-haven currency. Despite that, the evolving economic situation in China has been marked by unexpected negative developments, which have been weighing on risk assets.
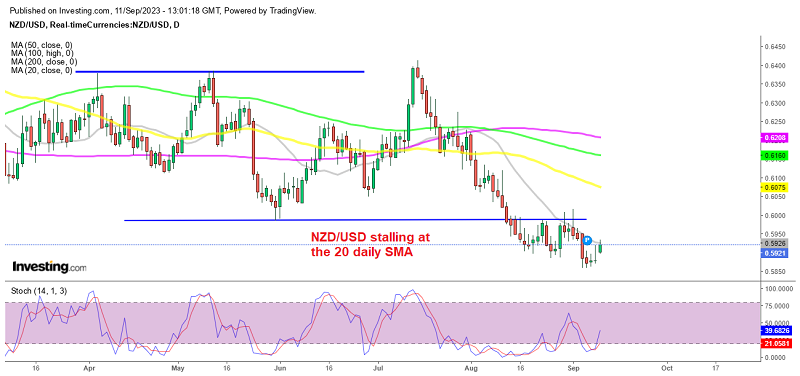
Specifically, commodity-linked currencies, often referred to as “commodity dollars,” have been going through a bearish momentum since the middle of July, as the daily chart above shows. NZD/USD saw a substantial decline of more than 500 pips, dropping below 0.60, with the 20 SMA (gray) turning into resistance.
NZD/USD H4 Chart – The 100 SMA Acting as Resistance

The retrace is complete as stochastic shows
So, the larger trend remains pretty bearish, but today we are seeing some buying pressure, which has pushed the price above 0.59. The US dollar (USD) has been losing strength recently, following last week when data pushed the Buck to a six-month high, as indicated by the US Dollar Index reaching 105.057. However, today the USD is retreating which can be attributed to the absence of significant economic data releases on the US calendar and a decrease in US Treasury bond yields, and is helping risk assets climb higher on the other hand.
The New Loans increased to 1,360B Yuan in China, suggesting that the government’s and PBOC efforts to help revive the economy by making it easier to borrow are having a positive impact which will likely help the real estate sector of the economy. This is helping improve the sentiment in financial markets, hence the 50 pip climb in this pair. Although the 100 SMA (green) is acting as resistance on the H4 chart above, while the 20 SMA (gray) is acting as resistance on the daily chart. So we decided to open a sell forex signal below these MAs, anticipating a bearish reversal soon.
NZD/USD
www.fxleaders.com

COMMENTS