SP 500 & NAS100 PRICE FORECAST:NAS100 and SPX Both Face a Key Resistance Test if the Rally is to Continue.A Slew of Earnings to Come After Market
SP 500 & NAS100 PRICE FORECAST:
- NAS100 and SPX Both Face a Key Resistance Test if the Rally is to Continue.
- A Slew of Earnings to Come After Market Close Could Push US Indices Past Key Resistance Levels.
- IG Client Sentiment Shows that Retail Traders are Overwhelmingly Long with 79% of Traders Currently Holding Long Positions.
- To Learn More About Price Action, Chart Patterns and Moving Averages, Check out the DailyFX Education Section.
Most Read: Gold Price Forecast: $1950 Key Support Approaches as Bears Eye Further Downside
Recommended by Zain Vawda
Get Your Free Gold Forecast
US Indices have rallied quite significantly over the past week and a half with SPX up around 7%, and the NAS100 around 9.2% before stuttering slightly today. Market participants are seeking fresh insight into the thinking of the US Federal Reserve regarding rate hikes and potential cuts in 2024. The recent rally benefitted from the assumption that the Fed are done with rate hikes but the recent hike by the Reserve Bank of Australia and hawkish comments from Fed policymakers have seen a renewal of the recent uncertain narrative.

Source: TradingView
Fed Chair Powell averted any comments on monetary policy today, but he is speaking tomorrow again and market participants will continue to keep an eye for any hints on Fed policy. If rates have peaked, then there is a real chance we could see further upside on the S&P 500. Looking at the individual stocks on the SPX and outside of Mega Cap tech stocks the valuations are relatively low which could lead to further upside for the rest of Q4. This would also tie in with the Q4 historical performance of US Indices.
EARNINGS, FEDSPEAK AND MICHIGAN SENTIMENT DATA
There remains a lot of earnings due out after market close today with the big names among them being Walt Disney (DIS), Virgin Galactic (SPCE), AMC Entertainment (AMC) and Marathon Digital Holdings (MARA). Keep an eye on any movements in after hours trade heading into the US open tomorrow.

For all market-moving economic releases and events, see theDailyFX Calendar
TECHNICAL OUTLOOK AND FINAL THOUGHTS
NASDAQ 100
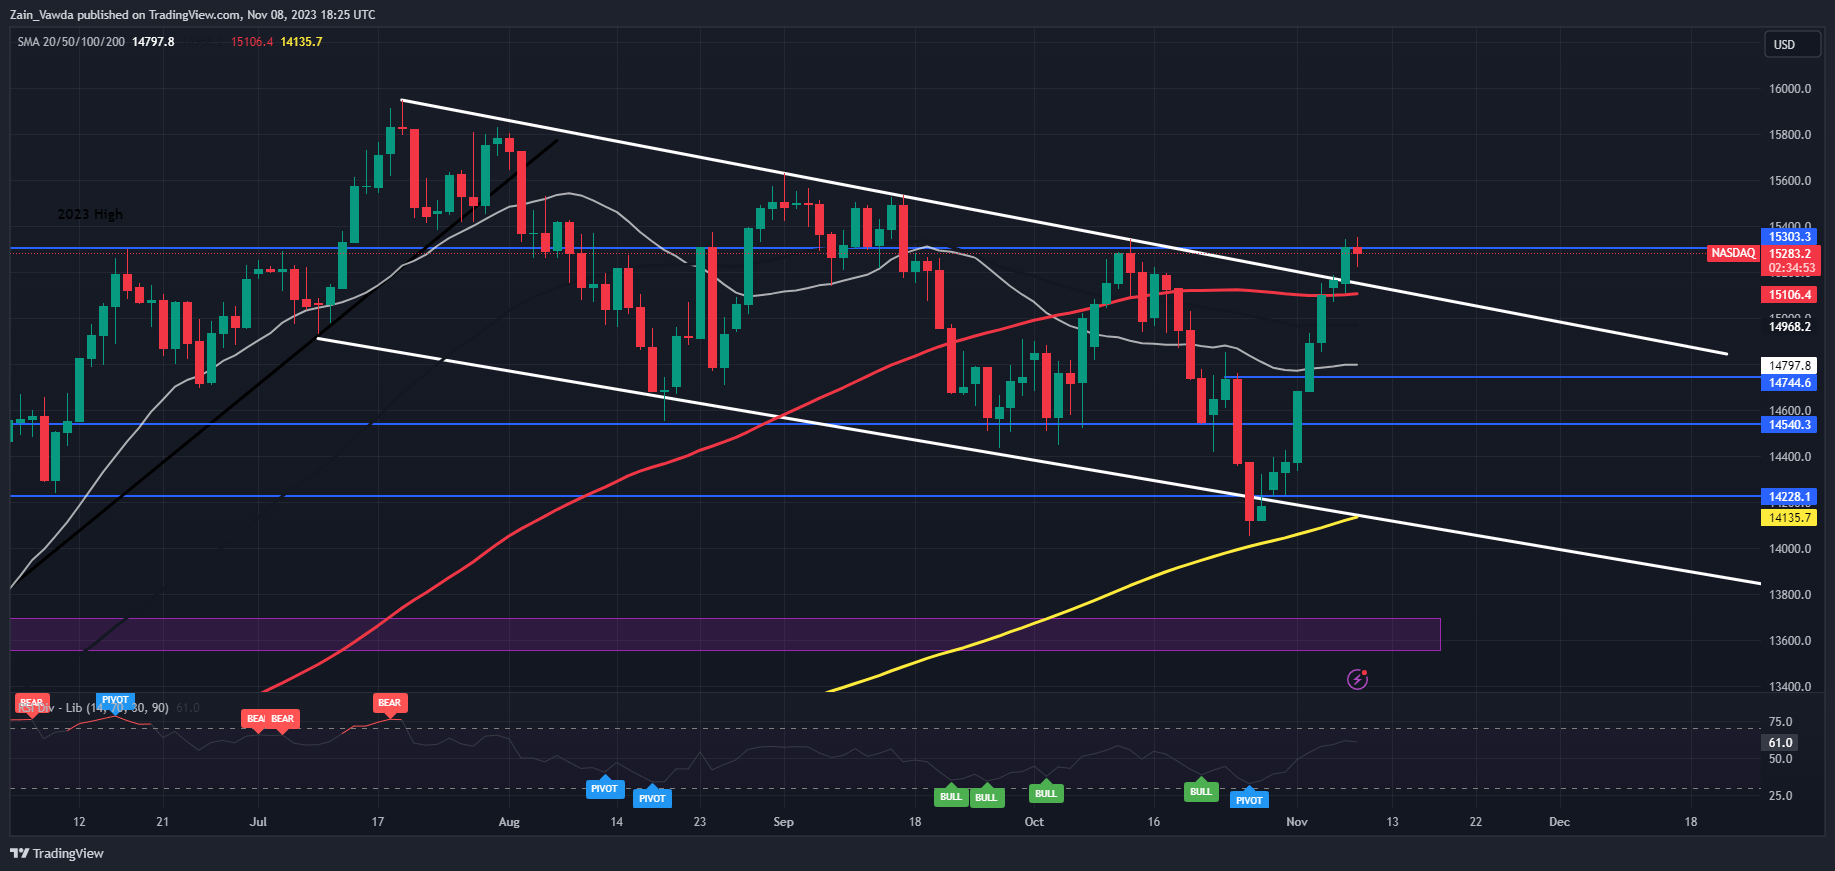
As mentioned earlier the Nasdaq has put in gains of nearly 10% from the recent lows printed last week. We have broken the channel which had been in play since the Middle of July. We have however run into a key area of resistance hence the slight indecision today.
Looking ahead and if price is able to push beyond the 15300 mark then further upside could take us toward the next resistance area around the 15500 mark which was the September swing high.
Alternatively, a push lower and rejection of the 15300 level could bring us back to retest the channel breakout at around the 15100 mark before a potential bullish continuation. If this level is broken support at 15000 and possibly the 20-day MA at 14800 will likely come into focus.
NAS100 November 8, 2023

Source: TradingView, Chart Prepared by Zain Vawda
S&P 500
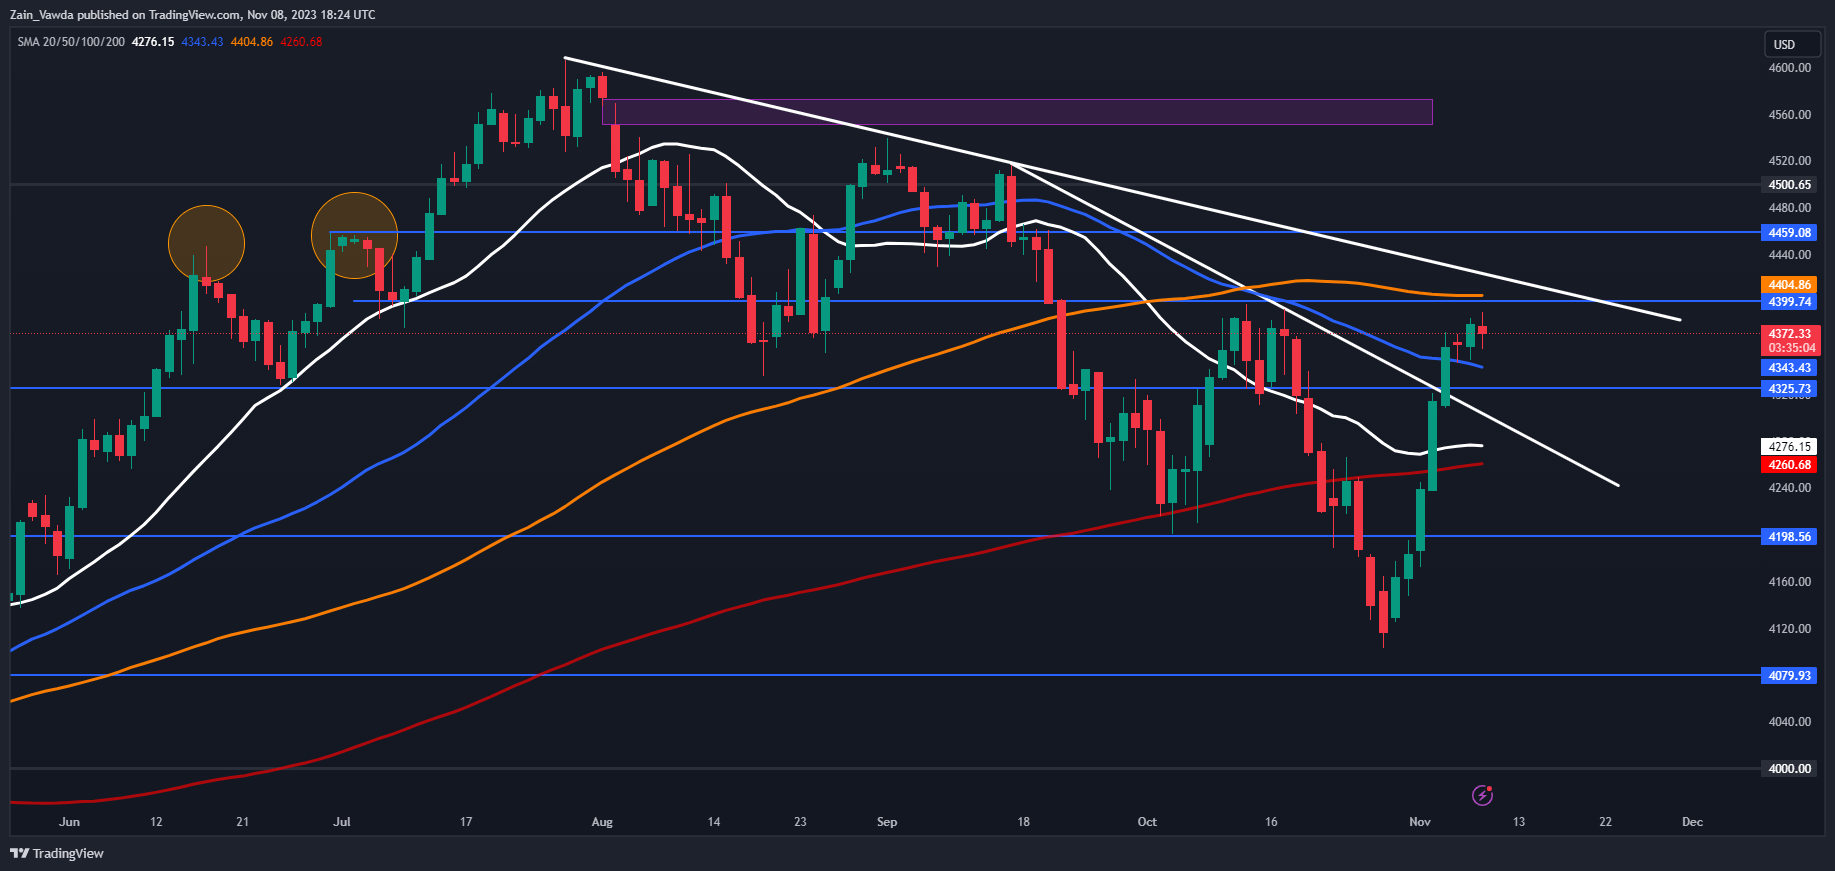
The SPX has had a similar run as the NAS100, breaking above the inner trendline and now faces a resistance level as well. A break above here will lead to a retest of the outer descending trendline which rests just above the 100-day MA and the 4400 mark.
A break above the outer trendline will bring resistance at 4460 into focus before the swing high at 4515 becomes an area of interest.
A rejection here could lead to a retest of the inner trendline and then lead to a bullish continuation. As is usually the case a breakout is followed by a retest before continuation (atleast in a perfect world).
Key Levels to Keep an Eye On:
Support levels:
Resistance levels:
S&P 500 November 8, 2023

Source: TradingView, Chart Prepared by Zain Vawda
| Change in | Longs | Shorts | OI |
| Daily | -6% | 6% | 0% |
| Weekly | -32% | 69% | 5% |
Written by: Zain Vawda, Markets Writer for DailyFX.com
Contact and follow Zain on Twitter: @zvawda
element inside the
element. This is probably not what you meant to do!Load your application’s JavaScript bundle inside the element instead.
www.dailyfx.com

COMMENTS