
S&P 500 AND NASDAQ 100 FORECAST:U.S. stocks sell off at the start of the week amid fragile market sentiment ahead of key economic data and the of
S&P 500 AND NASDAQ 100 FORECAST:
- U.S. stocks sell off at the start of the week amid fragile market sentiment ahead of key economic data and the official start of the second quarter earnings season
- S&P 500 slumps 1.15%, Nasdaq 100 sinks 2.2%
- This article looks at the key technical levels to watch for in the Nasdaq 100 over the next few days
Most Read: S&P 500, Nasdaq 100, Dow Jones Technical Forecast for this Week
U.S. stocks slumped on Monday amid fragile investor sentiment on recession anxiety ahead of key economic data and the official start of the earnings season. At the market close, the S&P 500 sank 1.15% to 3,854, with communication services, consumer discretionary and information technology leading the decline. The Nasdaq 100, for its part, plunged 2.1% to 11,860, despite the small pullback in U.S. Treasury yields. Meanwhile, the Dow fell 0.52% to 31,173, outperforming its peers on Wall Street, but lacking the momentum needed to finish in positive territory.
Looking ahead, U.S. consumer price index data, due for release on Wednesday will steal the limelight this week. In terms of consensus expectations, June inflation is seen rising 8.8% y-o-y from 8.6% y-o-y in May, although some analysts believe headline CPI could hit 9%, the highest level since November 1981.
Another inflation surprise, coupled with the tight labor market, could give the Federal Reserve cover to continue hiking borrowing costs forcefully into 2023 even if Wall Street is slowly positioning for the possibility of a policy pivot. With the direction of travel for interest rates firmly on the rise, volatility will stay elevated, reducing risk appetite and preventing equities from staging a meaningful and sustainable comeback.
The official start of the second quarter reporting period will also receive significant attention this week, with financial results from JP Morgan Chase (JPM), Morgan Stanley (MS), Wells Fargo (WFC) and Citigroup (C) being the most notable. Commercial and investment banks have a front row view of the economy, so traders should keep an eye on their numbers, but especially their guidance.
With the economic slowdown undermining demand, inflation compressing margins and the strong dollar hurting multinational profits, quarterly performance and forward-looking commentary may be a disappointment, paving the way for significant cuts in EPS projections for the broader market, a scenario that could spark the next leg lower in the equity space. Despite the growing headwinds, Wall Street analysts have yet to downgrade corporate earnings on a broad scale, but negative revisions could be just around the corner. When that happens, the S&P 500 and the Nasdaq 100 could be in for more losses.
NASDAQ 100 TECHNICAL ANALYSIS
The Nasdaq 100 jumped last week, rising more than 4%, but was unable to clear resistance in the 12,175/12,225 band. Upon reaching this area, prices quickly pivoted lower and resume their descent as sellers resurfaced to fade the rally amid lack of confidence in the tech sector’s ability to sustain gains. If downside pressure intensifies in the coming days, initial support is seen at 11,500, followed by 11,325. On further weakness, the focus shifts to the 2022 lows.
On the other hand, if dip buyers swoop in to pick up beaten down shares and spark a bullish reversal, the first resistance to consider appears at 12,175/12,225. If prices break above this barrier decisively, the index could be on its way to retest the 12,600 ceiling.
NASDAQ 100 CHART
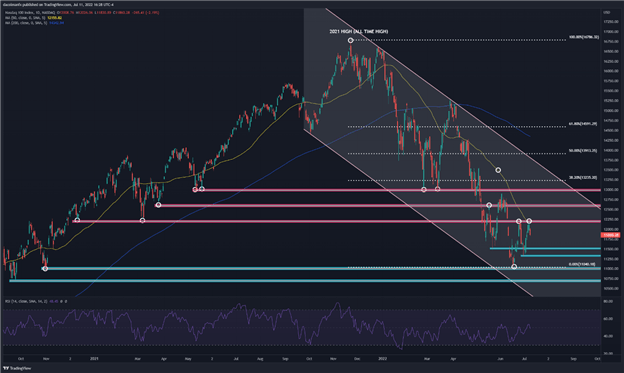
Nasdaq 100 Chart Prepared Using TradingView
EDUCATION TOOLS FOR TRADERS
- Are you just getting started? Download the beginners’ guide for FX traders
- Would you like to know more about your trading personality? Take the DailyFX quiz and find out
- IG’s client positioning data provides valuable information on market sentiment. Get your free guide on how to use this powerful trading indicator here.
—Written by Diego Colman, Market Strategist for DailyFX
element inside the
element. This is probably not what you meant to do!Load your application’s JavaScript bundle inside the element instead.
www.dailyfx.com