
Indices Fundamental Forecast: Bearish Recommended by James Stanley Get Your Free Equities Forecast It was a big week in
Indices Fundamental Forecast: Bearish
Recommended by James Stanley
Get Your Free Equities Forecast
It was a big week in stocks as the Tuesday CPI report brought a reversal scenario into the equation that got another shot-in-the-arm on Wednesday at the FOMC rate decision. Hopes for a FOMC pivot into rate cuts were dashed as Powell struck a hawkish tone, warning that the Fed ‘has a ways to go’ with inflation. And this really furthers the theme that’s been pushing stocks throughout this year: The Fed hikes to address inflation, markets get hopeful that the Fed has done enough, or at least made a push towards that end, and then matters reset as US data remains strong which illustrates that the Fed is, in fact, not yet done.
This led to massive counter-trend rallies in June and then again in October. That latter run saw stocks push back to the 200 day moving average, which has been in-play over the past five weeks in various ways, with this week seemingly highlighting failure from bulls to hold above that level with the indication that bears are back in the equation.
Fundamental Backdrop
Throughout this year as the Fed delivered a very hawkish message and pushed a pattern of tightening that hasn’t been seen in more than 40 years, markets handled the news relatively well. And oddly, there were multiple periods in which it seemed that equities were really ‘fighting the Fed,’ by showing strong bullish trends even as the Fed warned that more hikes were on the way.
In my opinion, much of this was sentiment-related, especially after the knee-jerk reaction of weakness in Q1. The Fed started to open the door for 2022 rate hikes at the September 2021 rate decision, forecasting a single hike for this year. In December, the bank shifted that outlook to 2-3 hikes and as we came into the New Year it became obvious that change was afoot.
And then in January another risk factor arose when Russia started lining the Ukrainian border with tanks. This culmination of risk factors was too great for even the most bullish market prognosticators to avoid, and in the first two months of this year a large bearish reaction developed which, oddly, bottomed on the very same day that Russia invaded Ukraine.
Recommended by James Stanley
Trading Forex News: The Strategy
That low on Feb 24th set the low for Q1, even as the Fed added their first rate hike in March while warning that many more were on the way. Equities even rallied after that rate decision, into quarter-end, and little did we know at that time that this dynamic would be setting the tone for 2022 trade…
Sellers were back with a vengeance in April, just after the Q2 open and they ran prices all the way into the June rate decision which, again, produced a dizzying counter-trend move. At that rate decision, the Fed hiked by 75 basis points which should’ve been a shock for markets. But, a Wall Street Journal report issued on the Monday before the rate decision, when the Fed was in a blackout window, prepared market participants for the news so that when the hike actually happened, there was little shock factor.
The S&P 500 set a low on the day after that rate hike – and then rallied for the next two months, even with the Fed hiking by 75 basis points again at the July rate decision. That rally held through early-August trade until, eventually, Jerome Powell wanted to get his point across to markets at the Jackson Hole Economic Symposium. At that speech, he took a shorter and more concise message to markets to warn that the fight against inflation was not over and that more rate hikes were on the way.
Markets began to sell-off again and that weakness remained through September and into October trade. But it was on October 13th that another counter-trend move began to show, this time on the back of a stronger-than-expected CPI print, which is pretty much the opposite of what one would think.
If markets are fearful of the Fed overtightening and inflation is still stubbornly high, wouldn’t that equate to greater hawkishness from the Fed? Nonetheless, stocks rallied for the next two months, until another CPI print, the one that was released this Tuesday.
And this time, inflation data was a bit more positive than hoped, with both core and headline CPI printing below expectations. But, just like the counter-trend response that was seen in October, the mirror image showed up this week, with sellers making a strong reversal push after the release of that inflation data. And then the next day, Jerome Powell warned that the Fed still ‘has a ways to go’ with the inflation fight.
The reason for the history lesson here is to highlight how the fundamental backdrop for stocks this year has actually been very bearish and probably more bearish than what’s shown on the chart. But markets aren’t linear mechanisms – there’s both buyers and sellers and that dynamic exists across a multitude of timelines, so when something suddenly changes, the ripple effects can create considerable distortion, such as we saw this year.
This also puts a bearish outlook for equities in 2023 as the Fed is not relenting. They will keep rates high until either inflation comes down, which will take some time, or until something breaks. Neither of those scenarios appears to be a long-term bullish factor for equities, and arguably, we haven’t even seen the repercussions of higher rates yet as these hikes are still relatively new. Perhaps some damage from that has been seen in crypto already, but corporates will have a more-difficult time operating in this higher rate environment and this will start to show more clearly in earnings reports in the first-half of next year.
S&P 500
As of this writing, the weekly bar in the S&P 500 is working on a bearish engulfing candlestick, illustrating this fast reversal through this week. Perhaps more interesting, however, is the daily chart showing the Tuesday CPI reversal, which is the mirror image of the CPI reversal from two months prior on October 13th. Also notable is the continued hold below the 2023 bearish trendline. And then more recently, the breach of support at the monthly lows of 3912 show bears taking greater control of the matter.
Recommended by James Stanley
Building Confidence in Trading
S&P 500 Daily Chart
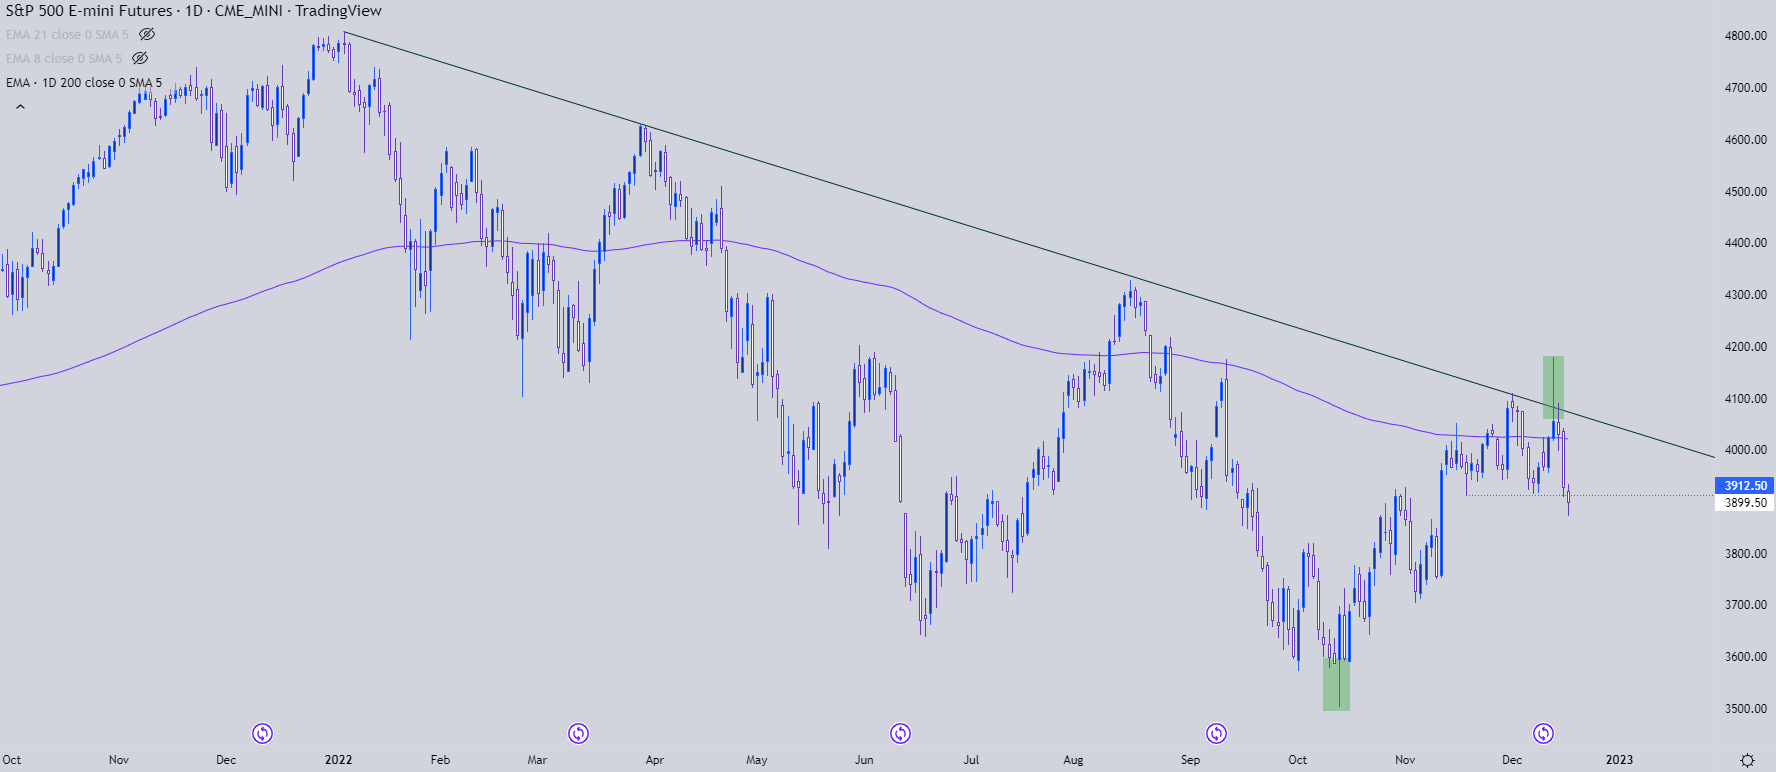
Chart prepared by James Stanley; S&P 500 on Tradingview
Nasdaq 100
The Nasdaq had a similar reversal theme showing this week, with a bearish engulf on the weekly chart. The notable item here in my opinion is the push back-below 11,700, which is the 50% marker of the pandemic major move.
The 61.8% retracement of that same major move helped to mark the low in October and bulls had made a strong effort to hold support at the 50% marker of that move, with five weeks of support at that level until this week, with sellers making a push back-below.
Recommended by James Stanley
Traits of Successful Traders
Nasdaq 100 Weekly Chart
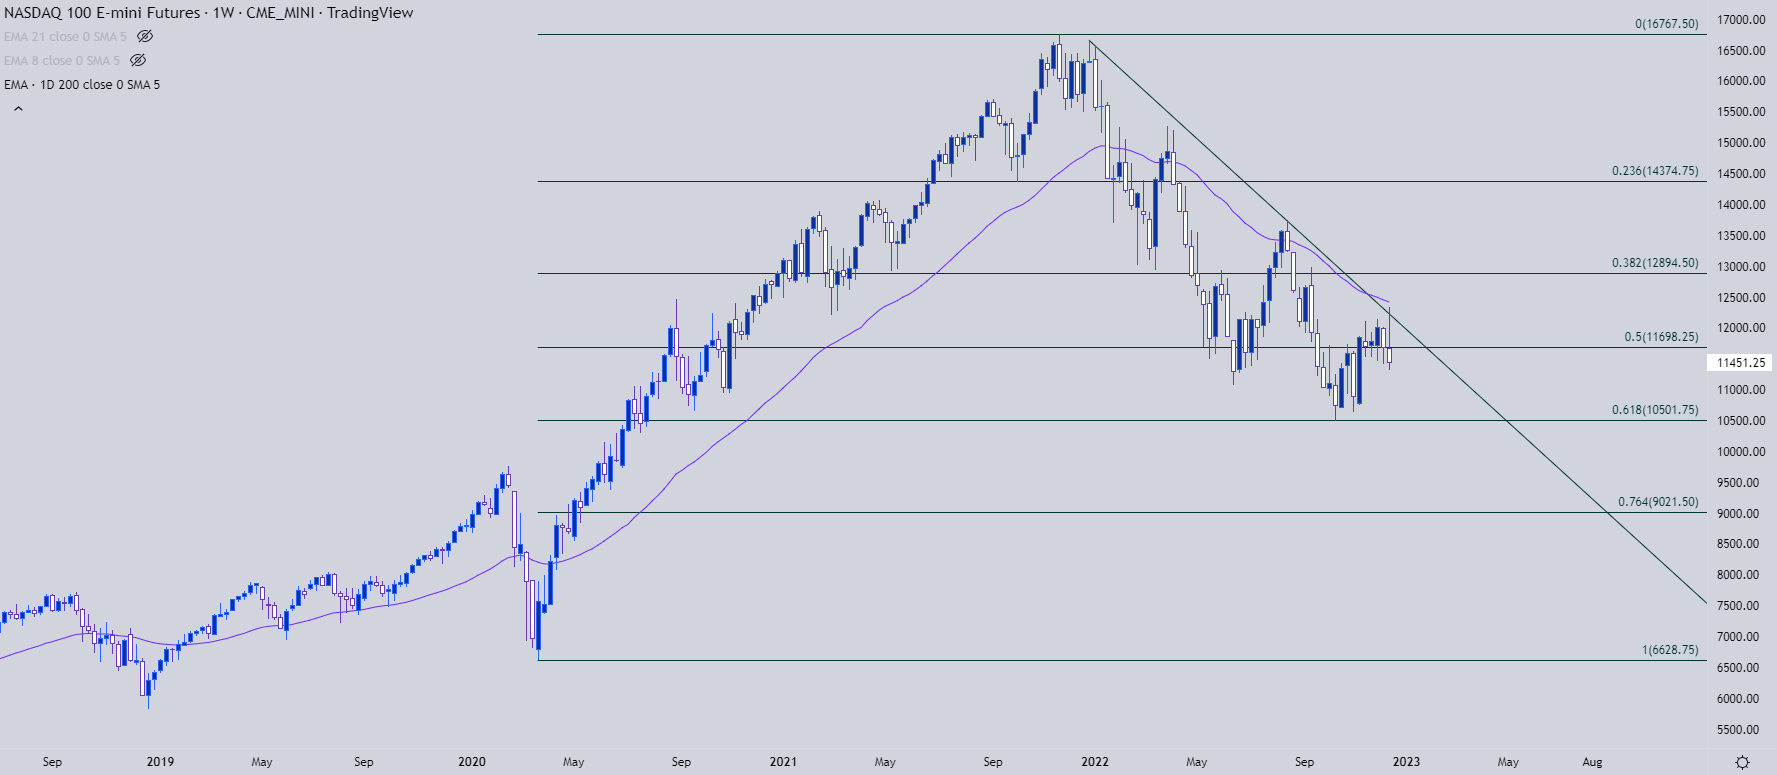
Chart prepared by James Stanley; Nasdaq 100 on Tradingview
The Dow
When the S&P 500 and Nasdaq set a fresh low on October 13th, the Dow set a higher-low, holding above the October 3rd inflection. And as bulls came back for the next two months, the Dow was the hot spot, running as high as 23.02% from that October low. This week has seen that bullish structure come into question with price pushing down to a fresh weekly low.
For those that are looking for bounce plays in equities into the end of the year, the Dow may hold some allure, largely on the prospect of support taken from a prior resistance trendline. While both the S&P and Nasdaq remain below their 2022 trendlines, the Dow is still above it’s own, and that currently projects to around 32,789, which is the September 13th swing high. At this point, bearish equity approaches appear more attractive in the S&P and Nasdaq.
Recommended by James Stanley
The Fundamentals of Trend Trading
Dow Daily Price Chart
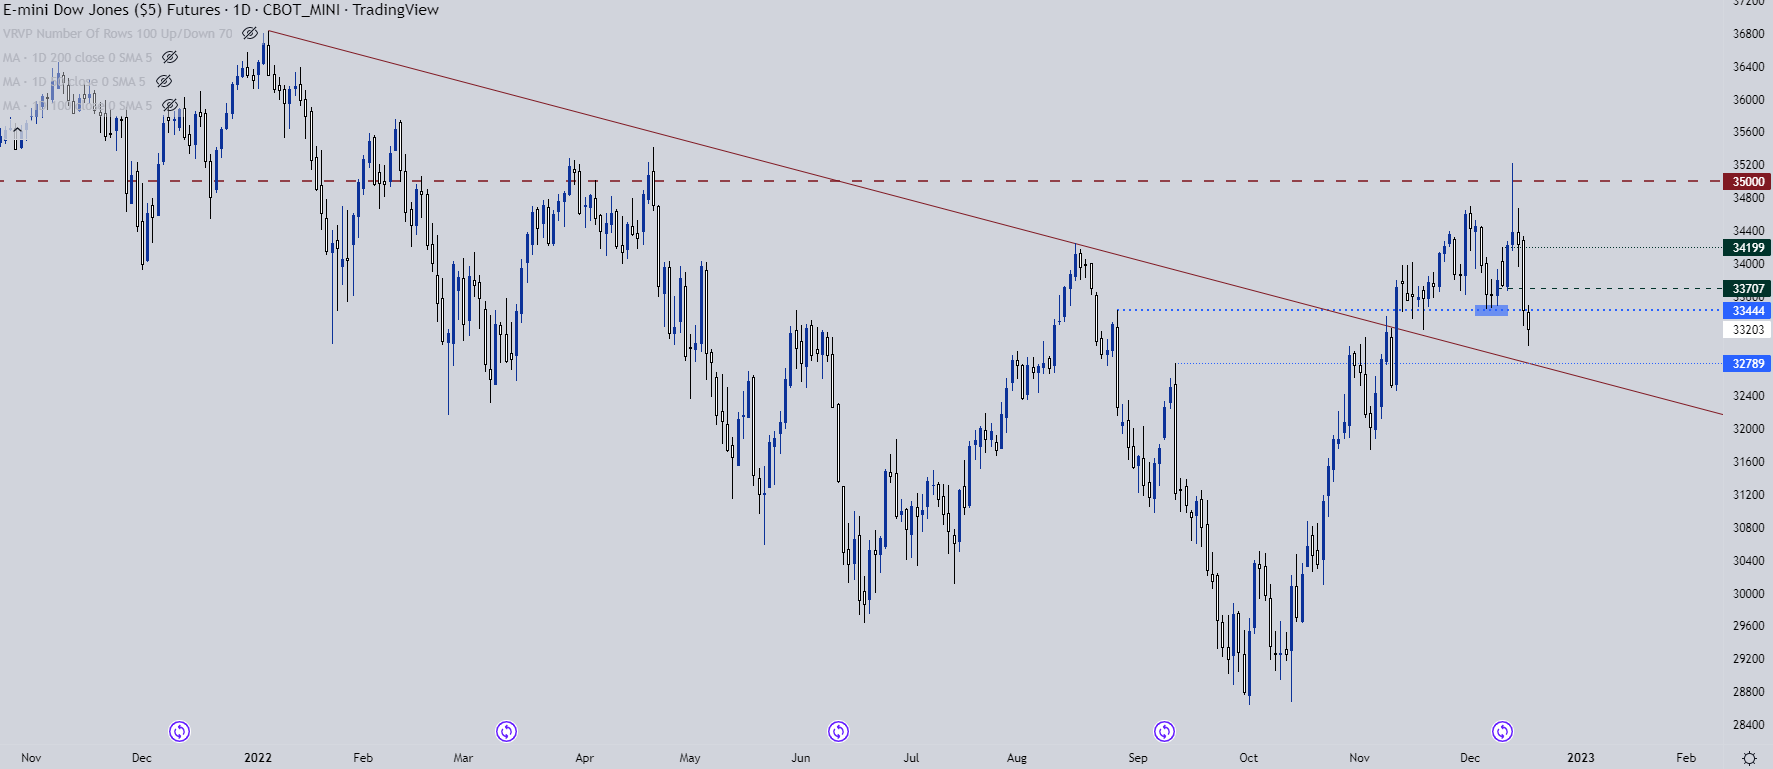
Chart prepared by James Stanley; Dow Jones on Tradingview
— Written by James Stanley, Senior Strategist, DailyFX.com & Head of DailyFX Education
Contact and follow James on Twitter: @JStanleyFX
element inside the
element. This is probably not what you meant to do!Load your application’s JavaScript bundle inside the element instead.
www.dailyfx.com