
Indices, USD Talking Points:It was a game of alphabet soup over the past few days with CPI, FOMC, ECB, and the BoE pushing markets ahead of year-end.U
Indices, USD Talking Points:
- It was a game of alphabet soup over the past few days with CPI, FOMC, ECB, and the BoE pushing markets ahead of year-end.
- U.S. equities put in a strong reversal on Tuesday after failing to hold a breakout at the 2022 bearish trendline.
- USD was bearish through yesterday’s FOMC rate decision, setting a fresh low overnight. But, bulls have started to show up, pushing DXY back-above 103.82 and testing outside of a falling wedge formation.
- Tomorrow brings a massive option expiry in US markets which can keep volatility pushing in equities through the end of the week.
- The analysis contained in article relies on price action and chart formations. To learn more about price action or chart patterns, check out our DailyFX Education section.
Recommended by James Stanley
Get Your Free Equities Forecast
Bears made a move to start the day. While Tuesday brought the reversal after CPI, bears were able to hold the move through FOMC yesterday and into this morning’s ECB and BoE rate announcements.
Collectively, taking a step back, inflation has continued to pullback but the Fed remains hawkish, as we heard yesterday. Chair Powell said the bank ‘still has a ways to go’ on their fight with inflation, dashing hopes for a quick pivot into a dovish stance as CPI printed at 7.1% on Tuesday. And while the initial reaction to that CPI print may have been bullish, the follow-through was anything but. And it did sync nicely with what I warned of in this week’s Technical Forecast for Equities.
This year’s price action in the S&P, despite being decisively bearish, has also been consolidation in the form of a falling wedge pattern. Such formations are often approached with the aim of bullish reversals, very similar to the shorter-term pattern that had built in the S&P coming into November trade. That shorter-term formation gave way on the CPI print released in November; but the longer-term pattern remained on pause. Early-December saw another trendline test at the top of the formation, and this is the same trendline that caught the high in August.
Tuesday’s initial bullish reaction breached the trendline but bears quickly came back to slam price right back down. That weakness has continued all the way until a re-test of support at the same spot that’s been holding the lows for the past month, and this was resistance ahead of the November breakout from the shorter-term wedge.
S&P 500 Daily Chart
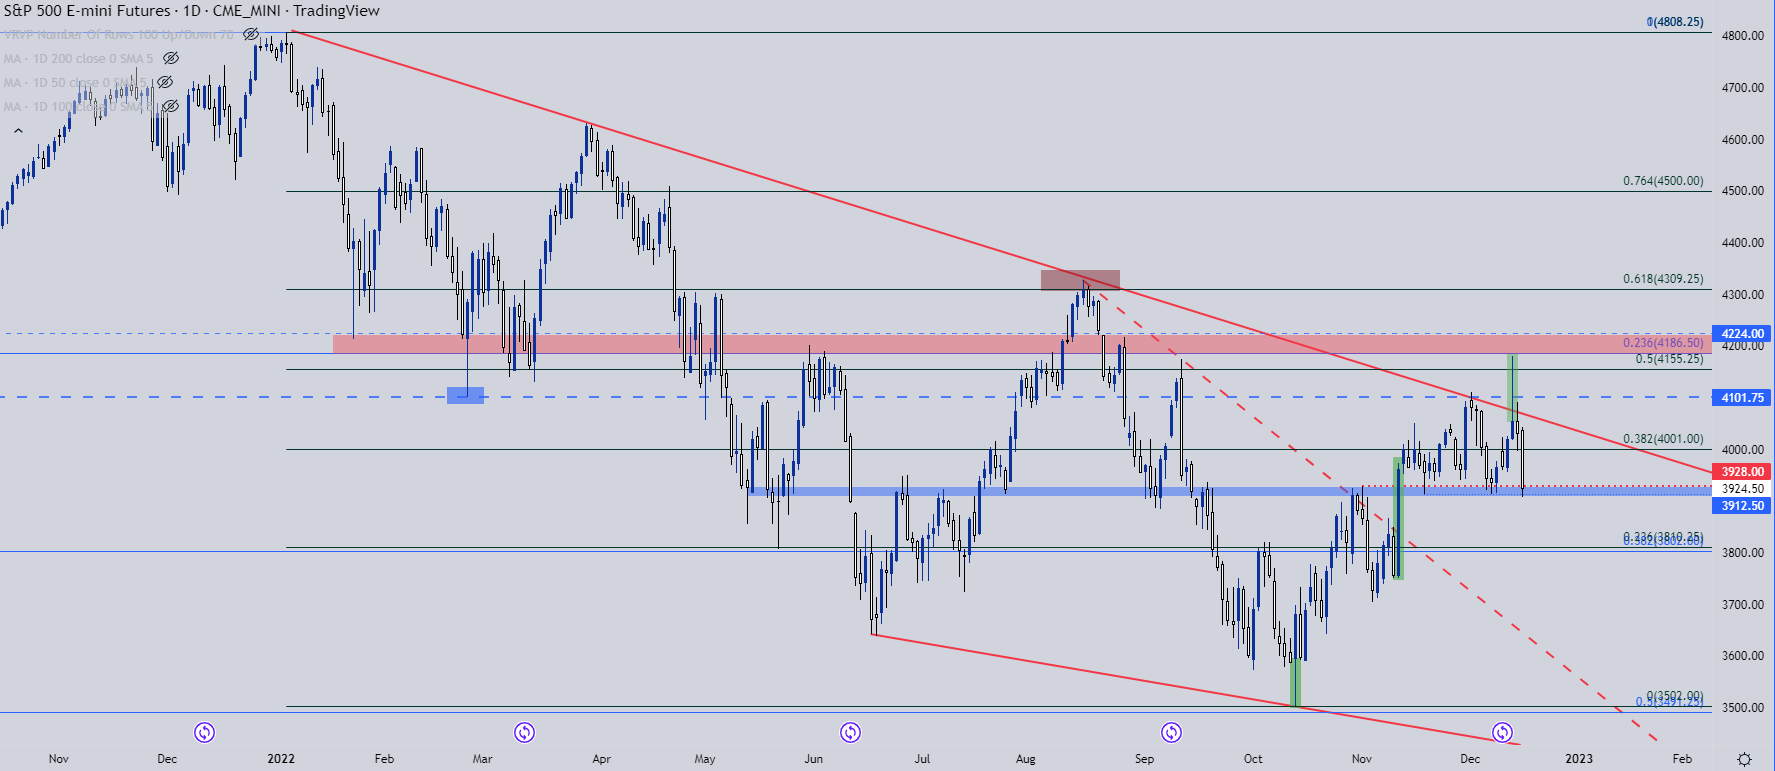
Chart prepared by James Stanley; S&P 500 on Tradingview
SPX Reversal Potential
The extended wick on Tuesday, right after a CPI report, is the mirror image of what happened two months earlier. On October 13th, a higher-than-expected CPI release brought a fresh jolt of fear into markets.
The S&P 500 hurriedly pushed down to the 3500 area (setting a low of 3502 on ES) before starting to reverse. By the time US markets opened bulls had already made a mark but that theme continued with a really strong day of price action.
That led to the bullish build of a falling wedge, which broke-out in November on the back of a softer-than-expected CPI report. That helped to propel price to fresh three month highs until, eventually, resistance started to show at the 2022 bearish trendline.
And then Tuesday’s CPI report helped to bring a bearish reversal to the matter, begging the question as to whether sellers will get some continued run, similar to how bulls had run off the October 13th reversal. As I wrote yesterday, the big test for bears is at the same support that showed up today, plotted from around 3912-3928.
S&P 500 Daily Chart
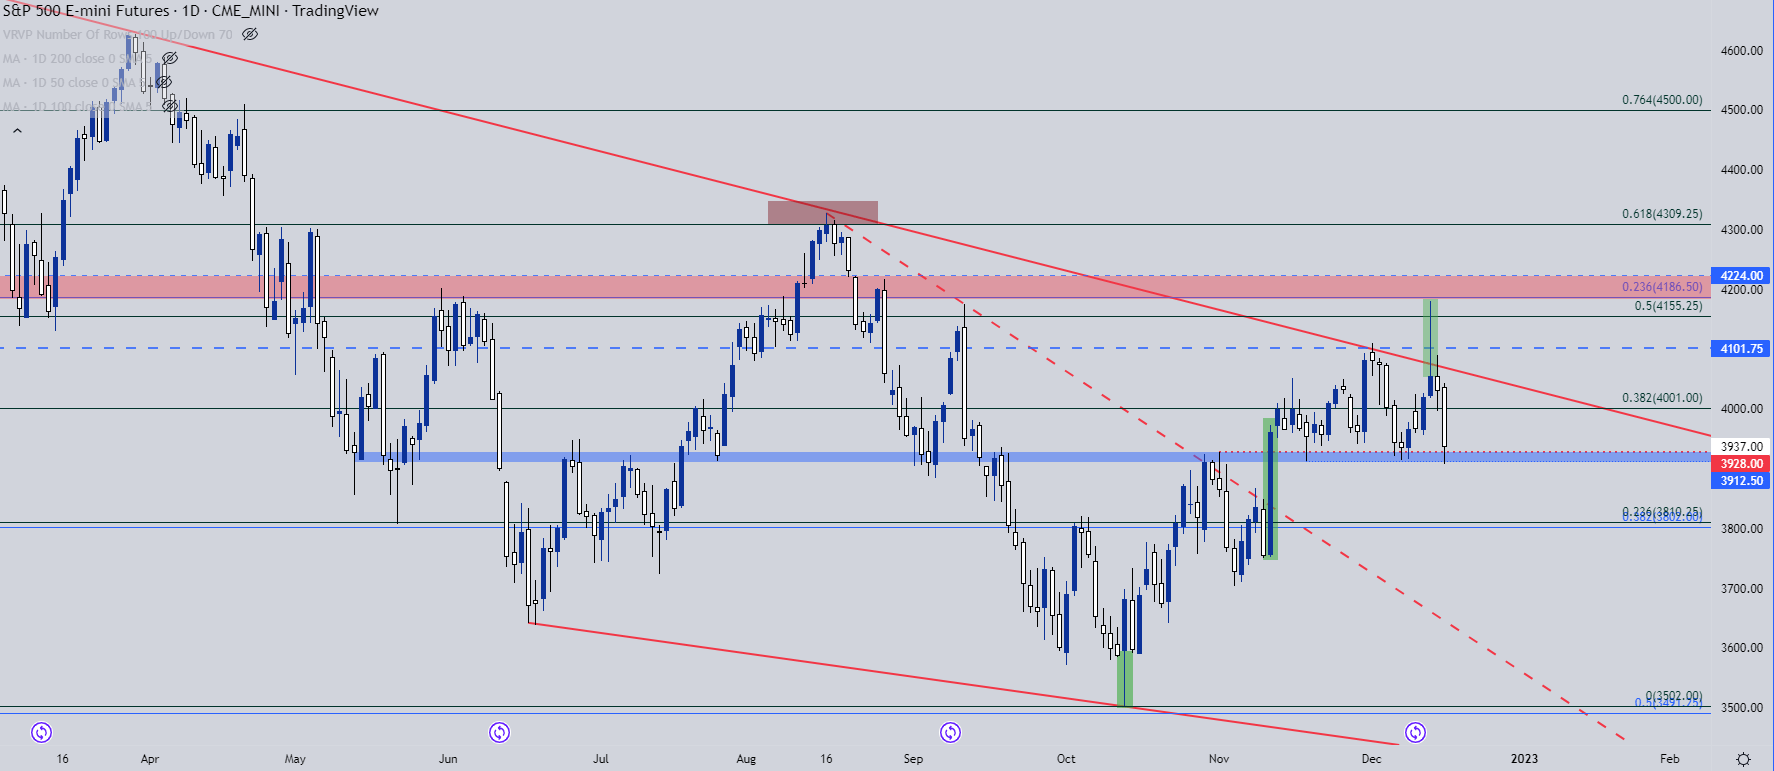
Chart prepared by James Stanley; S&P 500 on Tradingview
SPX into OpEx
Tomorrow brings a massive options expiry and that’s something that’s brought a strong impact to equities this year. I’m less convinced of directional scenarios from that driver. But, am expecting higher levels of volatility and this is something that can contribute to the longer-term context in equities.
I had discussed this in this week’s forecast, highlighting the seasonality component. After tomorrow, there’s just two weeks left to the end of the year and that’s populated with a couple of holidays that will likely keep liquidity very low. And given the bearish response in equities throughout this year and the lack of obvious drivers in that two week period, logically, this could lead to some pullback as longer-term shorts close positions into the end of the year. And that could open the door for some early-January reversals, similar to what showed in 2020 and again in 2022.
On a shorter-term basis, this opens the door for another resistance test at the 4k psychological level, which is confluent with a Fibonacci level. On the support side of the matter, if bears can finally elicit a push back-below 3912, follow-through support could be sought at 3852 and then a confluent spot around 3802-3815.
Recommended by James Stanley
The Fundamentals of Breakout Trading
S&P 500 Four-Hour Price Chart
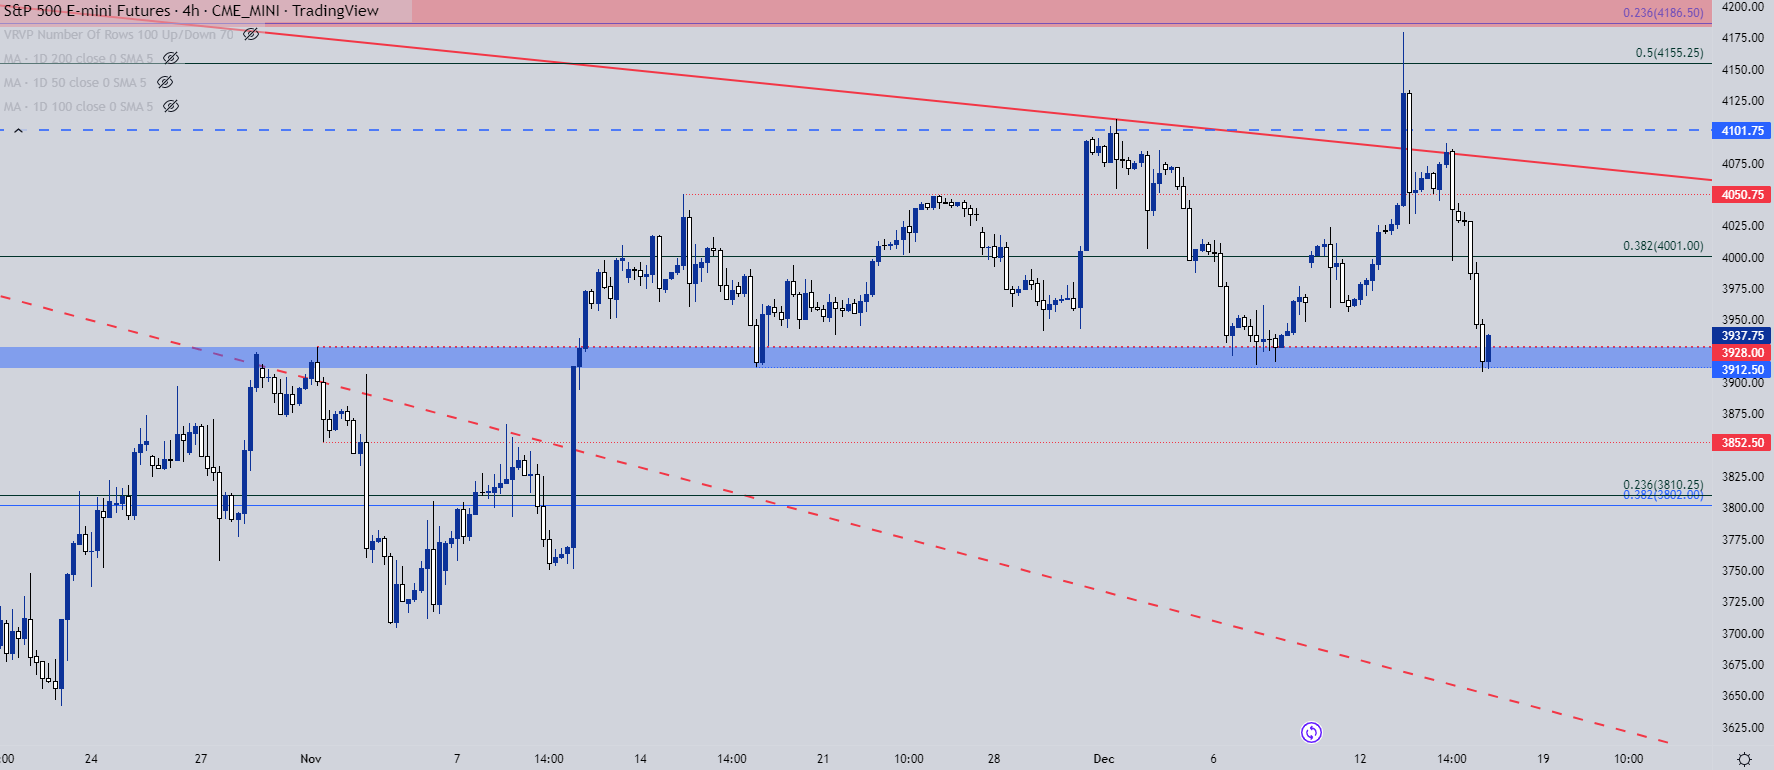
Chart prepared by James Stanley; S&P 500 on Tradingview
Nasdaq
The Nasdaq remains in a bearish spot on a longer-term basis. From the weekly chart below, we can see where the October low printed at a key spot on the chart, which was my first target from the Q4 top trades on the index at 10,501. This week’s reversal has been particularly impactful, with a not-yet-complete bearish engulfing candlestick showing after the Tuesday reversal.
If we do see bearish equity themes continue in 2023, the Nasdaq remains as an attractive venue.
Recommended by James Stanley
Top Trading Lessons
Nasdaq Weekly Chart
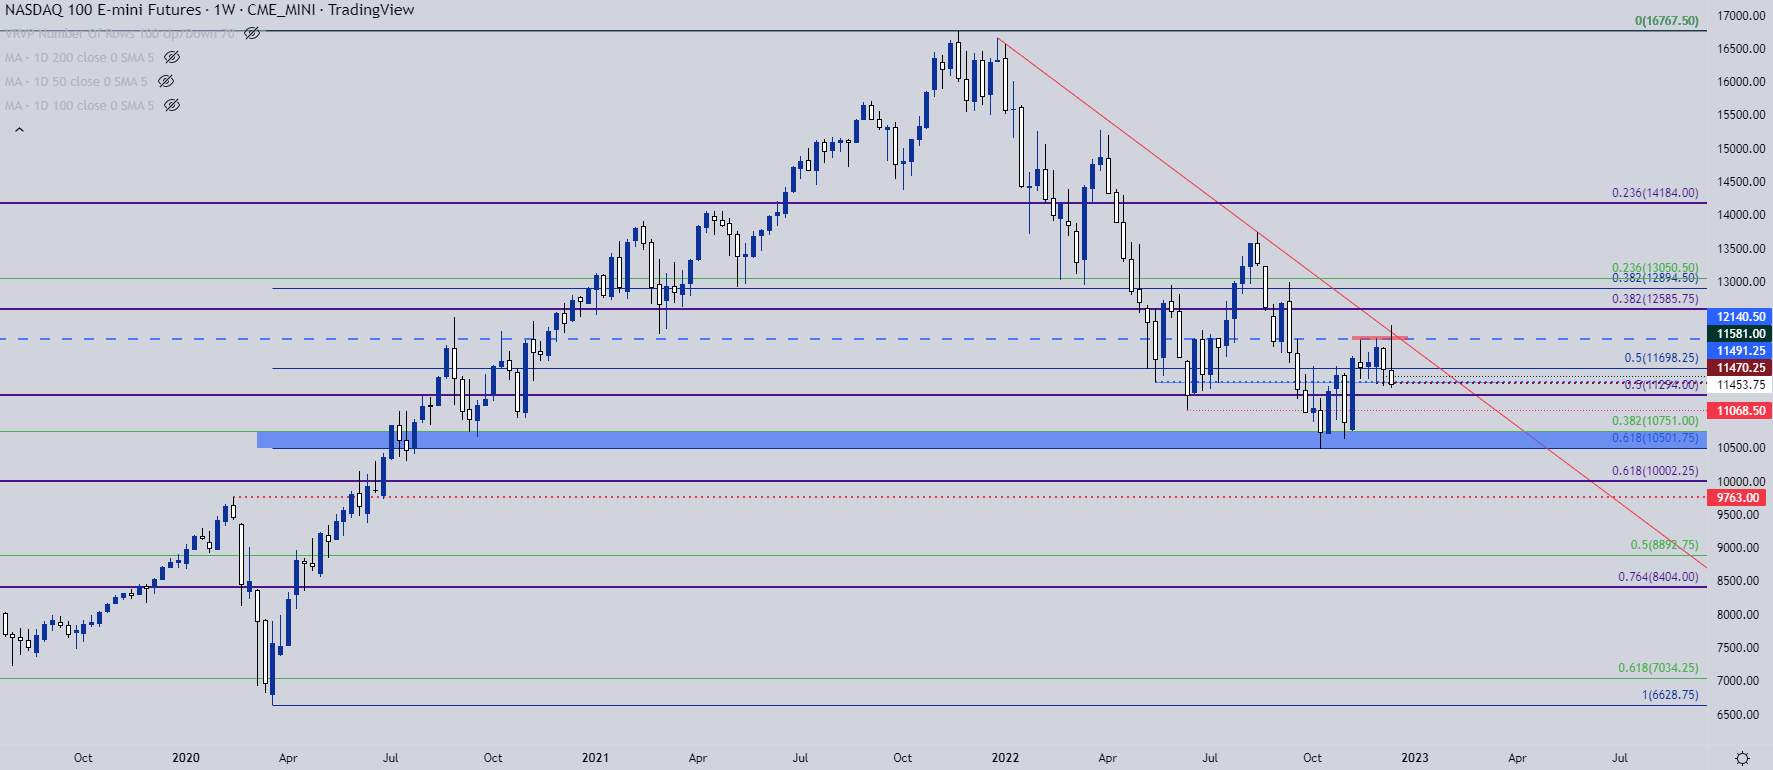
Chart prepared by James Stanley; Nasdaq 100 on Tradingview
On a shorter-term basis, price has made progressively lower-lows in the Nasdaq after testing a spot of support now for a third time in the past couple of weeks. Bears have an open door to push for breakdown at this point, the big question is whether they walk through it and OpEx tomorrow complicates matters to a degree. But – the test of lower-high resistance could be telling here, if bulls can muster such a move, opening the door for resistance tests at 11,581 or the Fibonacci level around 11,700.
Nasdaq Four-Hour Chart
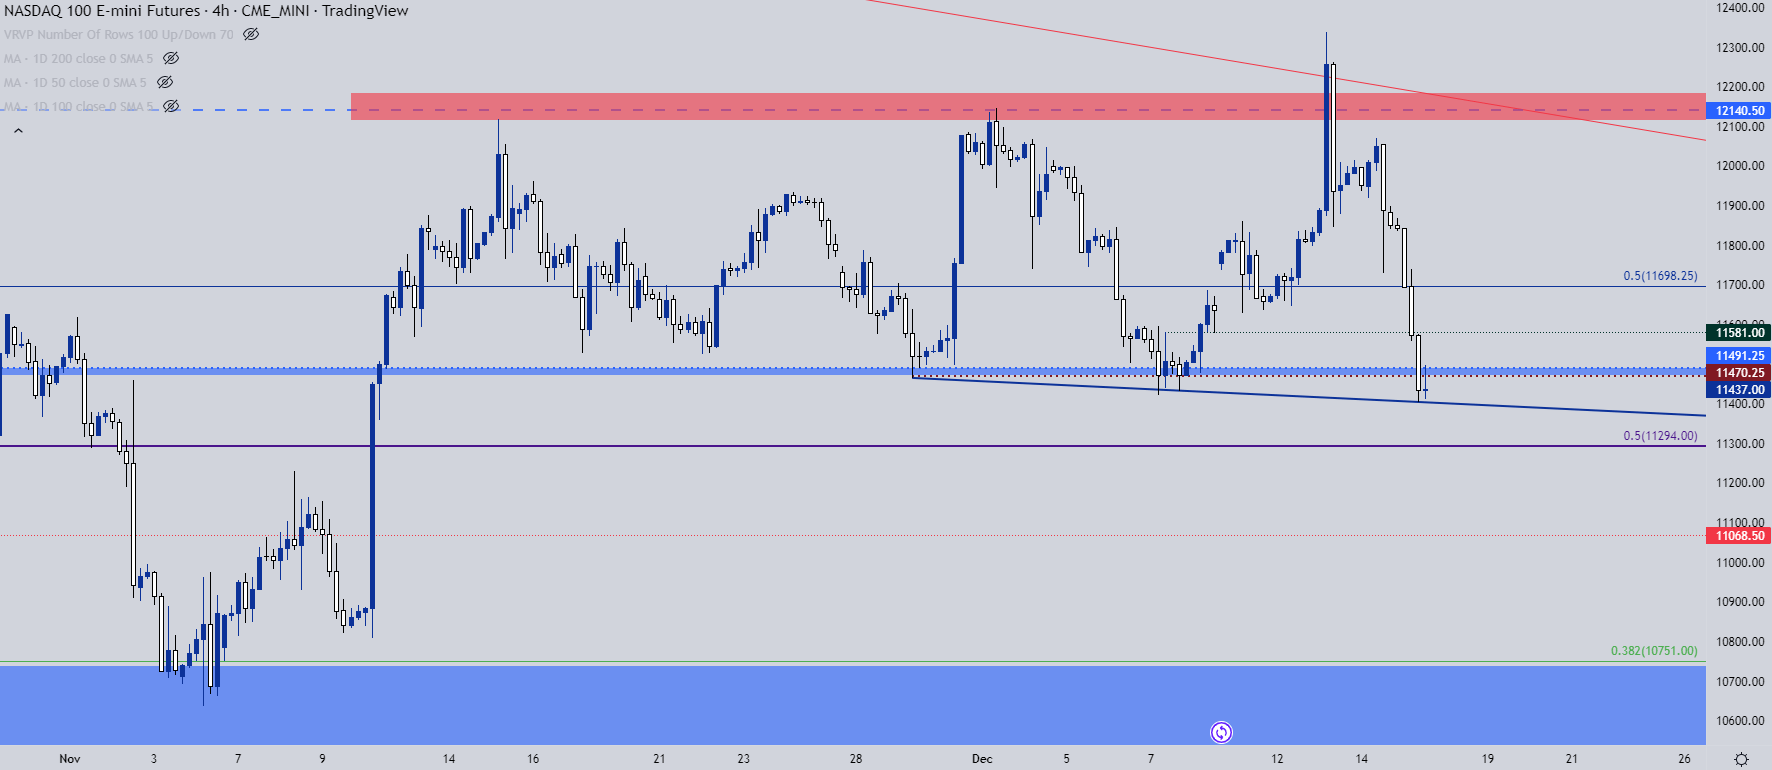
Chart prepared by James Stanley; Nasdaq 100 on Tradingview
USD Pushes Back
My takeaway from yesterday’s FOMC was that Powell was quite hawkish. The market response didn’t necessarily reflect that, however, with a net response of USD-weakness after the rate decision.
USD continued the slide into early trade this morning, but with some help from ECB and BoE rate decisions, started to show some early signs of possible reversal. The short-term falling wedge formation that I highlighted yesterday has yielded to a bullish breakout and this starts to open the door for bulls to make a larger move here.
Recommended by James Stanley
Traits of Successful Traders
US Dollar Two Hour Price Chart
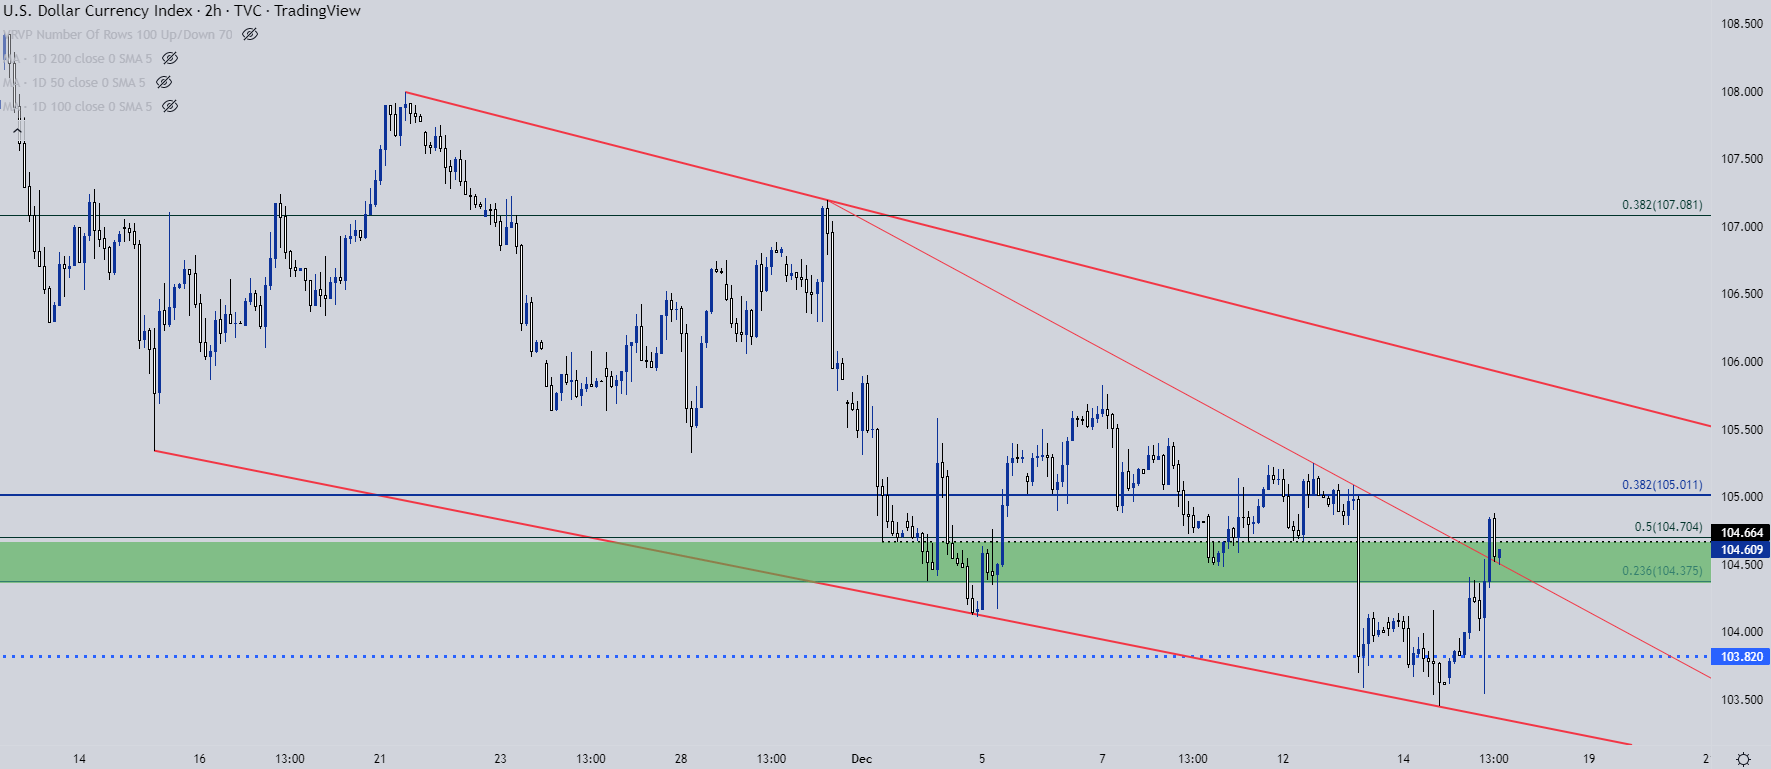
Chart prepared by James Stanley; USD, DXY on Tradingview
USD
Taking a step back, USD bulls still have some work to do to re-claim the trend. There’s more resistance sitting overhead, at a Fibonacci level that’s confluent with the 105 psychological level. Then, above that, is another bearish trendline, making up another longer-term falling wedge. That trendline currently projects to around 106 on DXY, but if bulls can force that break the door starts to re-open to bullish USD themes. The big question is whether that’s next week or next year, at this point.
US Dollar Four-Hour Chart
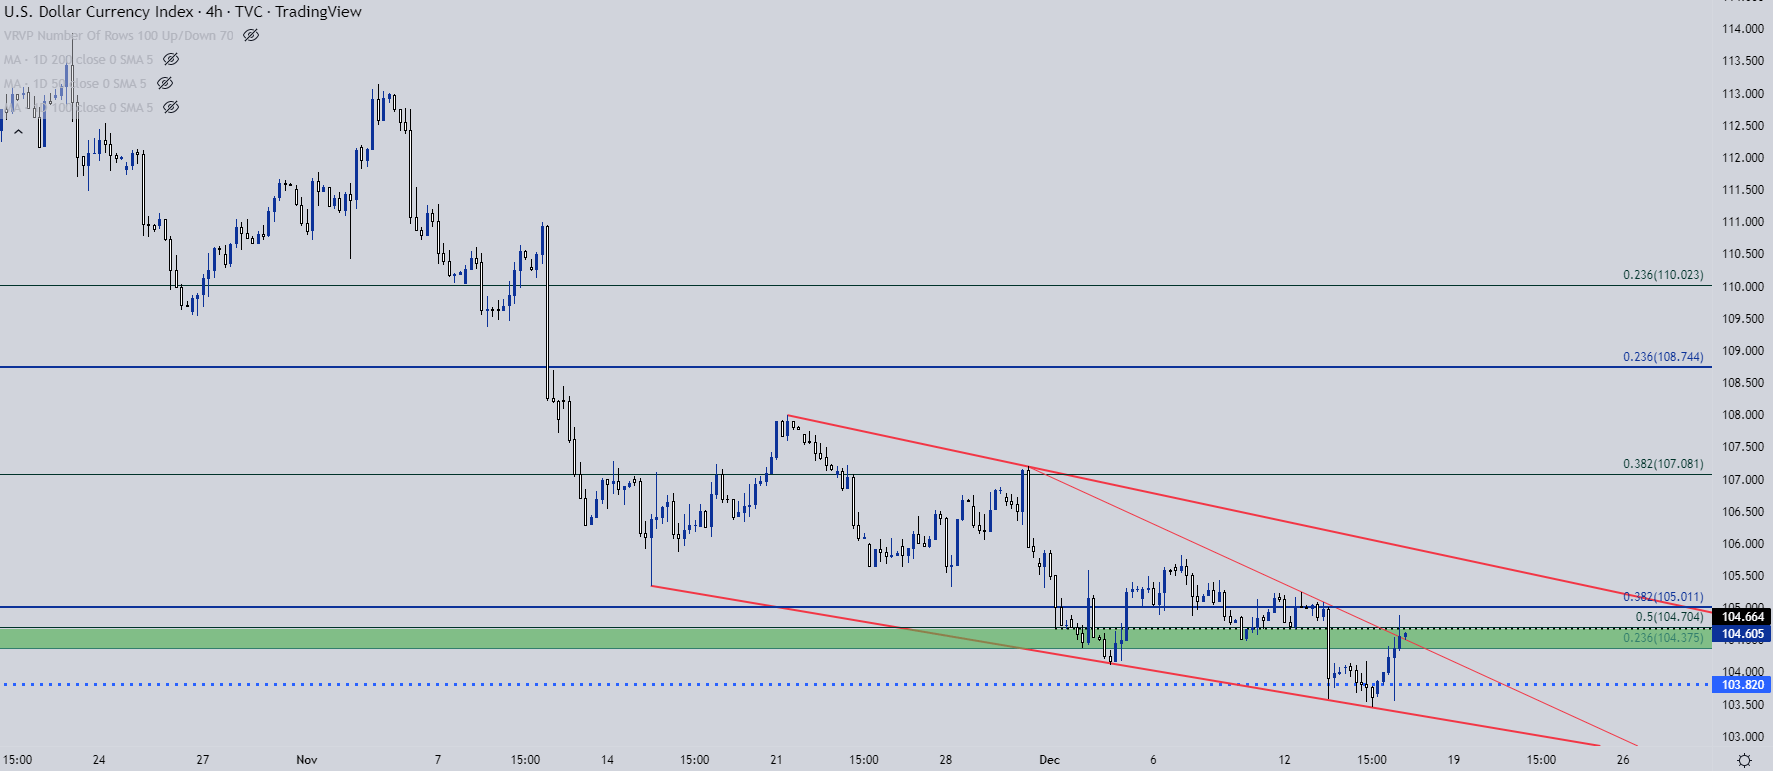
Chart prepared by James Stanley; USD, DXY on Tradingview
EUR/USD
On the topic of USD directional biases, the question of whether the USD has hit a low can be meshed with the question of whether EUR/USD has topped. Today’s daily bar may be a first step in that direction, as the ECB-fueled pullback in the pair helped to create a bearish engulfing formation on the daily chart. As of this writing, there’s still a little over an hour until that bar closes, thereby confirming the formation; but if we do, in fact, see that hold into the close that keeps the door open for pullback scenarios in the pair.
The big question for continuation there is whether bears can push back-below the 1.0500 area, as there’s a mass of support potential running from the psychological level up to the Fibonacci level at 1.0579.
Recommended by James Stanley
How to Trade EUR/USD
EUR/USD Daily Price Chart
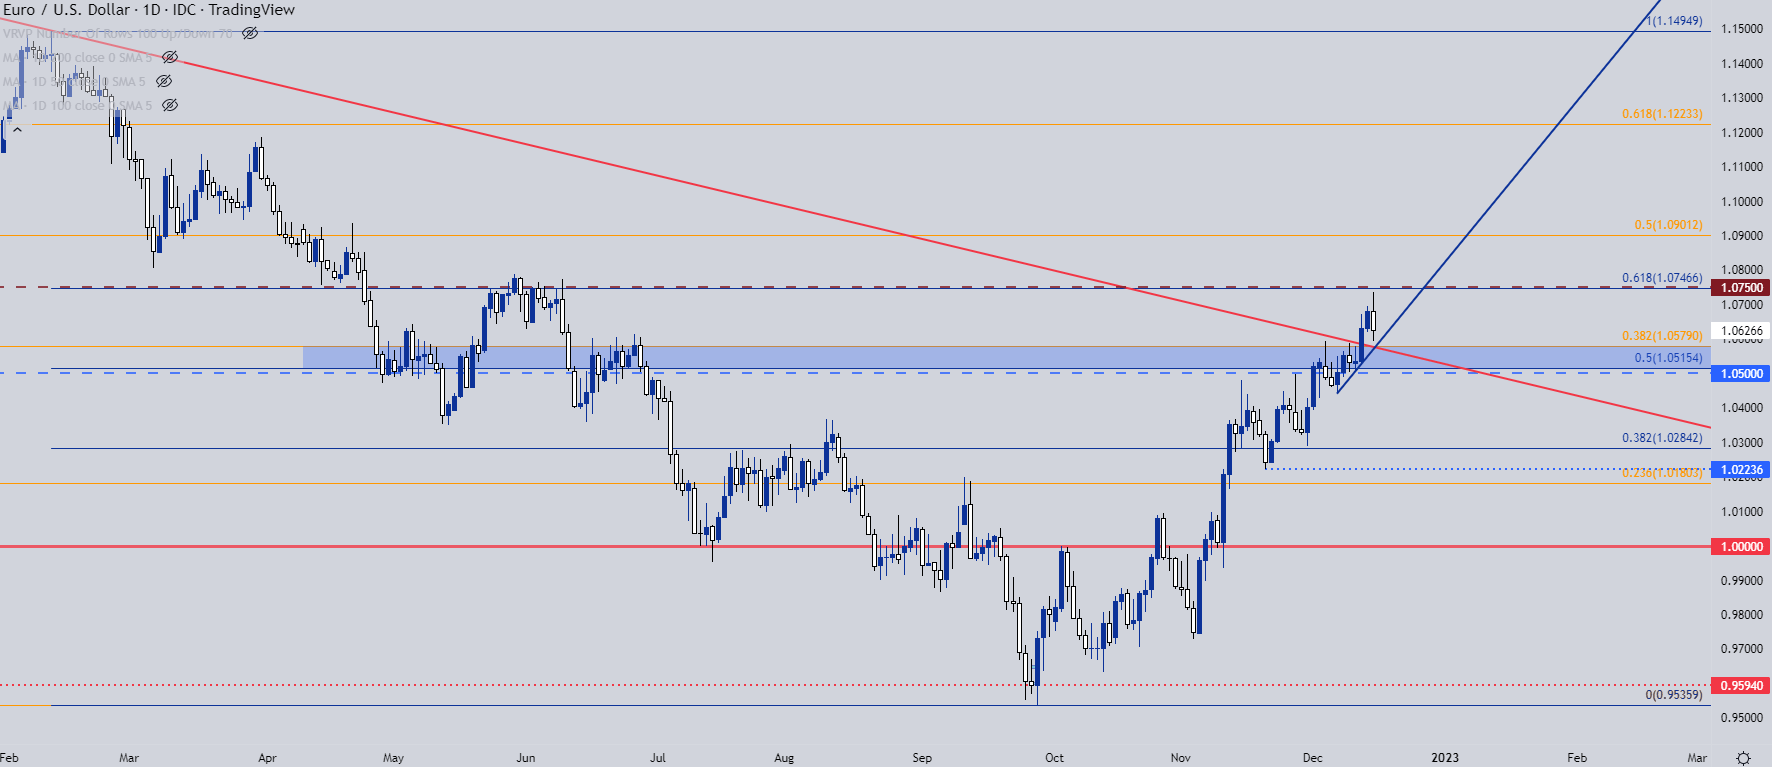
Chart prepared by James Stanley; EURUSD on Tradingview
— Written by James Stanley, Senior Strategist, DailyFX.com & Head of DailyFX Education
Contact and follow James on Twitter: @JStanleyFX
element inside the
element. This is probably not what you meant to do!Load your application’s JavaScript bundle inside the element instead.
www.dailyfx.com