They say numbers don’t lie, but when it comes to the Forex market, they sure do dance. Step into the world of the Relative Strength Index (RSI), your
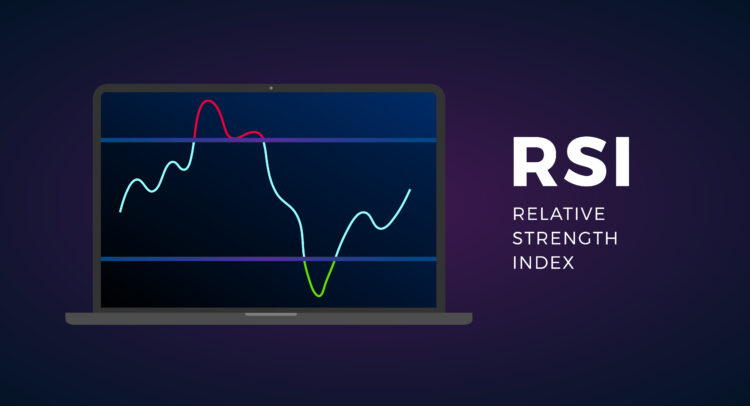
They say numbers don’t lie, but when it comes to the Forex market, they sure do dance. Step into the world of the Relative Strength Index (RSI), your new best friend—or foe—if you don’t know how to handle it. Let’s tear into what makes the RSI a power player in the crowded theater of Forex indicators.
Developed by J. Welles Wilder in 1978, the RSI isn’t exactly the new kid on the block, but it’s been a staple of traders and investors for decades. This momentum oscillator measures the speed and change of price movements from zero to 100. Think of it as your financial speedometer, telling you whether the market is too fast, too slow, or just right.
Breaking Down the Basics
The RSI helps make the invisible visible by highlighting ‘overbought’ or ‘oversold’ conditions. Here’s a breakdown of the basics:
- Overbought Territory: RSI levels above 70. This is the market screaming that prices might need a breather—like a marathon runner who’s gone too hard and needs to slow down.
- Oversold Territory: RSI levels below 30. Imagine a Black Friday sale; everything’s too cheap, and it’s probably not going to stay that way.
Connie Brown’s Modern Twist
In 2008, Connie Brown’s book “Technical Analysis for the Trading Professional” revolutionized the use of the RSI. When the RSI was developed, markets often moved within tight ranges—they’re not so polite anymore, as they trend hard. Brown recalibrated the RSI’s sensitivity for today’s aggressive markets, suggesting modified thresholds for bull and bear conditions:
- Bull Market Levels: Overbought zones at 80 and 90, with oversold thresholds at 50 and 40.
- Bear Market Levels: Overbought at 55 and 65, with oversold markers at 30 and 20.
These aren’t static magic numbers but rough guidelines. Brown advises fine-tuning these levels for specific instruments using historical peaks and troughs.
The RSI, like any indicator, isn’t a crystal ball. It’s more like a highly trained guide dog—it can lead you through traffic, but you still need to know when to cross the street.
Live Currency Rates – TipRanks.com
www.tipranks.com

COMMENTS