
US STOCKS OUTLOOK:U.S. stocks rallied during morning hours after core CPI grew less than expected, but gave up all gains and dropped into negative te
US STOCKS OUTLOOK:
- U.S. stocks rallied during morning hours after core CPI grew less than expected, but gave up all gains and dropped into negative territory in the late trade
- Despite signs that inflation may have peaked, the outlook remains uncertain for the stock market amid rising interest rates and slowing economic activity
- In this article we analyze the key technical levels of the Nasdaq 100 to watch out for in the coming sessions
Most Read: US Dollar Price Action Setups Post US CPI – EUR/USD, GBP/USD and USD/JPY
U.S. stocks jumped in the morning trade bolstered by positive mood on hopes that inflation may have topped out, but gave up all gains and finished the day moderately lower as sellers resurfaced to fade the rip on Wall Street. When it was all said and done, the S&P 500 declined 0.34% to 4,397, wiping out a 1.4% advance and losing ground for the third consecutive session. The Nasdaq 100, for its part, reversed a 2% rally and fell 0.36% to 13,940, touching its lowest level since March 17, as investors continued to de-risk their portfolios amid various economic headwinds.
Earlier in the day, the Bureau of Labor Statistics released last month’s inflation data. According to the report, the consumer price index hit 8.5% on an annual basis in March, the hottest reading since December 1981. While the increase on the headline gauge was disconcerting, the surge was mostly driven by soaring energy prices, a driver that may reverse in the coming months amid recent oil weakness (WTI has fallen more than 20% from last month’s high). Core CPI, for its part, rose 6.4% year-on-year, two tenth of a percent below forecasts, restrained by a steep decline in used vehicle costs, an indication that underlying price pressures are not broadening as aggressively as before and that the worst may be over.
U.S. Treasury yields moved a touch lower on the core inflation miss, offering temporary respite to the equity market and tech shares. However, bullish sentiment didn’t last long as the fundamental picture has not changed, at least in the short term. This means that the Fed is likely to press ahead with its plans to frontload hikes and start trimming its balance sheet soon in an effort to restore price stability and credibility.
The aggressive monetary tightening roadmap contemplated by policymakers will fuel volatility and weigh on stocks, especially if the economy continues to slow down and businesses start issuing profit warnings. We will know more about the outlook in the coming days once the first quarter earnings season gets underway in earnest and companies begin to release their financial statements and forward guidance, but if results disappoint, traders should brace and position for further weakness.
Although the macro environment is becoming increasingly challenging for many sectors, there are still good opportunities out there. For instance, the energy space remains highly attractive and could continue to outperform in the near future. With WTI oil prices in the ~$100 per barrel range, many companies in the E&P segment will rake in billions in profits and boost shareholder returns substantially, paving the way for the next leg higher for the entire group.
NASDAQ 100 TECHNICAL ANALYSIS
The Nasdaq 100 soared in the morning trade, but failed to maintain bullish momentum as traders questioned the sustainability of the rally and sold the rip amid elevated uncertainty about the outlook, a sign that bears remain firmly entrenched in the driver’s seat. On that note, if downside pressure intensifies in the coming days, the tech index could challenge the 13,375-support, followed by the 2022 low.
On the flip side, if buyers return and drive the market higher, the first resistance to consider appears at 14,000/14,070, followed by 14,370, the 50-day simple moving average. On further strength, the focus shifts up to 14,900, the 50% Fibonacci retracement of the November 2021/March 2022 decline.
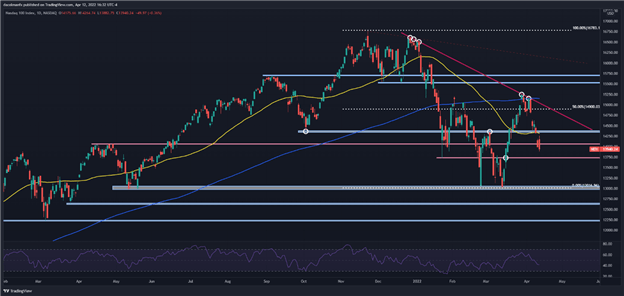
Nasdaq 100 (NDX) chart prepared in TradingView
EDUCATION TOOLS FOR TRADERS
- Are you just getting started? Download the beginners’ guide for FX traders
- Would you like to know more about your trading personality? Take the DailyFX quiz and find out
- IG’s client positioning data provides valuable information on market sentiment. Get your free guide on how to use this powerful trading indicator here.
—Written by Diego Colman, Market Strategist & Contributor
element inside the
element. This is probably not what you meant to do!Load your application’s JavaScript bundle inside the element instead.
www.dailyfx.com