
USD/ZAR, USD/TRY Talking Points:Has a hot US CPI print Solidified Another 75b/p Rate Hike?Persistent inflation has jeopardized the demand for EM (eme
USD/ZAR, USD/TRY Talking Points:
Has a hot US CPI print Solidified Another 75b/p Rate Hike?
Persistent inflation has jeopardized the demand for EM (emerging market) currencies with lockdowns in China and USD strength providing an additional catalyst for developing nations.
For the South African Rand (ZAR), falling commodity prices and a reduction in the number of goods exported to China is an additional headwind for the volatile Rand, with ‘loadshedding’ and the safe-haven appeal of the greenback driving USD/ZAR back towards September 2020 levels.
Following the release of US inflation data, another fresh four-decade high US CPI reading of 9.1% (YoY) in June appears to have solidified the prospects for the Federal Reserve to hike rates by a minimum of 75 basis point rate hike at the July FOMC, enhancing Dollar appeal.
Central Banks and Monetary Policy: How Central Bankers Set Policy
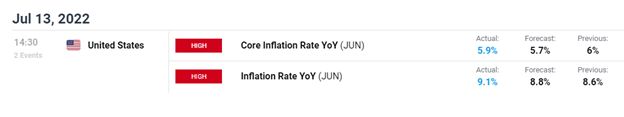
DailyFX Economic Calendar
USD/ZAR Technical Analysis
Upon release of the data, USD/ZAR rallied sharply before running into a wall of resistance at 17.175.
USD/ZAR 5 Minute Chart
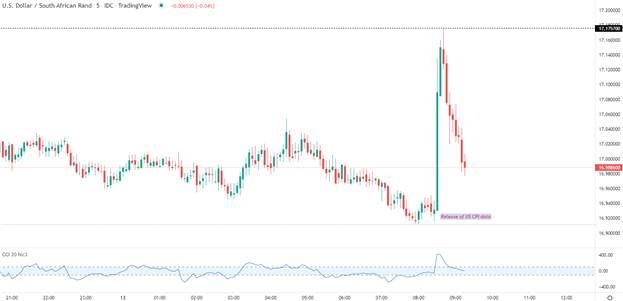
Chart prepared by Tammy Da Costa using TradingView
However, once the information had been digested, bears were able to drive prices back below the major 17.00 psychological level (current resistance) with the next level of support holding steady at 16.753 (the 23.6% Fibonacci of the August 2020 – June 2021 move).
USD/ZAR Daily Chart
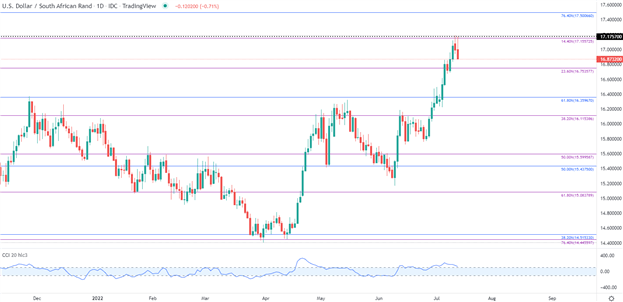
Chart prepared by Tammy Da Costa using TradingView
USD/TRY Technical Analysis
Meanwhile, the Turkish Lira is trading back above the June high at 17.43 in an effort to drive USD/TRY above 17.5. After temporarily falling to 16.04 late last month (26 June), a swift rebound has allowed bulls to regain control over the prominent trend, pushing the CCI (Commodity Channel Index) closer to overbought territory.
USD/TRY Daily Chart
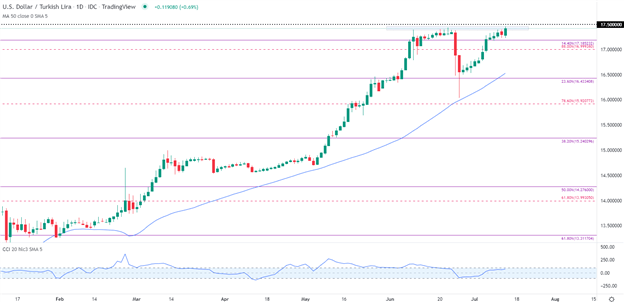
Chart prepared by Tammy Da Costa using TradingView
As highlighted on the hourly chart, recent price action has been trading in a broader range, with the 14.4% Fibonacci providing additional support at 17.185. For the bullish trend to remain intact, price action will need to break above the current range, bringing the 18.00 handle into play.
USD/TRY Hourly Chart
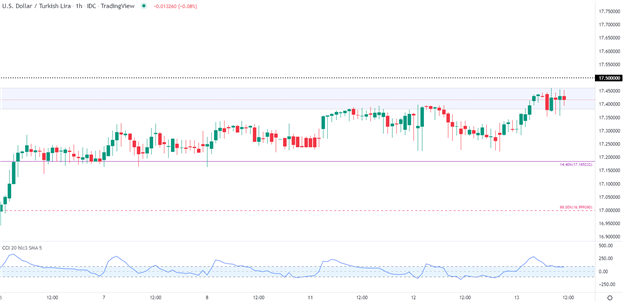
Chart prepared by Tammy Da Costa using TradingView
— Written by Tammy Da Costa, Analyst for DailyFX.com
Contact and follow Tammy on Twitter: @Tams707
element inside the
element. This is probably not what you meant to do!Load your application’s JavaScript bundle inside the element instead.
www.dailyfx.com