
US Dollar, Nasdaq 100 Talking Points:The rates theme continues to drive markets and equities remain in a somewhat vulnerable state. This is also p
US Dollar, Nasdaq 100 Talking Points:
The rates theme continues to drive markets and equities remain in a somewhat vulnerable state. This is also pushing the US Dollar higher as the Greenback has pushed up to a fresh 2021 high, breaking beyond the resistance that I had looked at on Monday.
In that article on Monday, I pointed out an ascending triangle formation in the US Dollar, which is often approached with the aim of bullish breakouts. That formation has filled in quickly, helped along by last week’s announcement from the Federal Reserve. While the bank didn’t have a tapering announcement to formally make, they did upgrade their rate forecasts, warning of a potential hike in 2022 whereas the prior dot plot matrix from the Fed indicated that the first hike might show in 2023.
That USD strength was on display into the end of last week, but this week is when the theme really came to life as USD has continued to break out from that ascending triangle formation.
To learn more about the ascending triangle formation, check out DailyFX Education
US Dollar Daily Price Chart
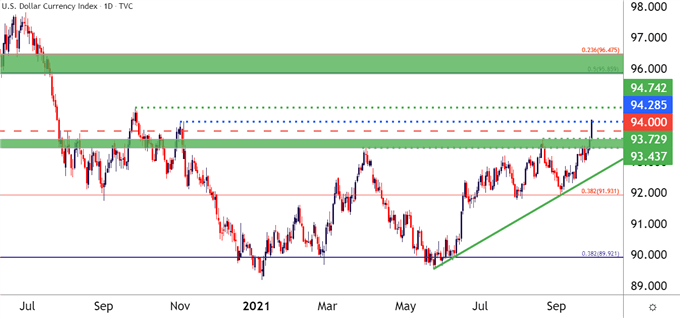
Chart prepared by James Stanley; USD, DXY on Tradingview
Tech Stocks Grasp for Support
Tech stocks in the US have been very vulnerable to rates themes in the US this year. In Q1, when rates were running higher in anticipation of recovery, tech stocks lagged; but when we were seeing a lower rate environment as covid numbers started to run higher, tech stocks would catch a bid and outperform.
With this warning from the Fed last week, tech stocks have been on their back foot and this morning saw the Nasdaq 100 push down to another fresh monthly low. At this point, support is holding a bit above the August low, plotted around 14,710; and the bullish channel that’s been in-place since the election last year also remains in working order.
The next support level below the August low is the July low, plotted at around 14,445, and this is nearing confluence with the support side of the bullish channel.
To learn more about trendlines, check out DailyFX Education
Nasdaq 100 Daily Price Chart
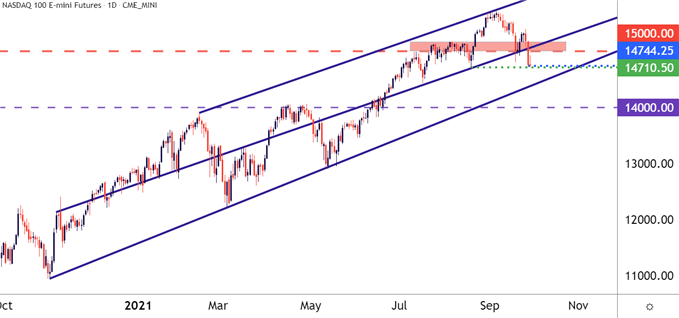
Chart prepared by James Stanley; Nasdaq 100 on Tradingview
— Written by James Stanley, Senior Strategist for DailyFX.com
Contact and follow James on Twitter: @JStanleyFX
element inside the
element. This is probably not what you meant to do!Load your application’s JavaScript bundle inside the element instead.
www.dailyfx.com