
US Dollar Talking Points:The US Dollar put in another bearish break yesterday, running down to a spot of support that was in-play two weeks ago as the
US Dollar Talking Points:
- The US Dollar put in another bearish break yesterday, running down to a spot of support that was in-play two weeks ago as the projected target from a double top formation.
- There’s a batch of support points just below USD price action including a trendline, a Fibonacci retracement and a series of prior swing highs.
- Tomorrow brings CPI data for the month of October and this is the next major push point for USD price action.
- The analysis contained in article relies on price action and chart formations. To learn more about price action or chart patterns, check out our DailyFX Education section.
Recommended by James Stanley
Download our US Dollar Forecast
The bullish trend in the USD took another hit yesterday after a support bounce fell flat. Sellers pushed down to create a fresh monthly low in the currency but soon found support at the same level that was in-play a couple of weeks ago, functioning as a target for a double top formation at 109.62. There’s also a batch of levels just below that swing and this could keep the door open for a support bounce ahead of tomorrow’s release of CPI data.
The bigger question at least from my vantage point, is whether a stronger recovery can show in the Euro. The single currency was battered and beaten over the past nine months and as I started looking at in October, the pain was starting to recede and the door was opening into a deeper pullback. And that’s started to show, although EUR/USD bulls haven’t been able to get a significant run above parity yet, there’s been a building support case and the door may be open for more if EUR/USD can provoke another bullish breakout.
This is all very tenuous at the moment and that’s largely as a result of the drivers in the equation. It was just a week ago that we had the most recent FOMC rate decision and that response has been entirely erased from currency markets with the USD erasing all of those Fed-fueled gains and then some. This happened even despite a clearly-hawkish outlay from Chair Powell at the press conference.
Given that the USD (via DXY) is 57.6% Euro, it’s rationale to ponder whether the dynamics in that pair have had a larger drive for near-term USD price action than another iteration of fundamental hawkishness from the FOMC.
At this stage, the USD is testing back-above the 110.00 psychological level after garnering support around 109.62. Price hasn’t yet set a higher-high off of the below four-hour chart so there’s no confirmation yet of a possible trend shift, although that can change if price can budge back-above yesterday’s swing high at 110.61.
US Dollar Four-Hour Price Chart
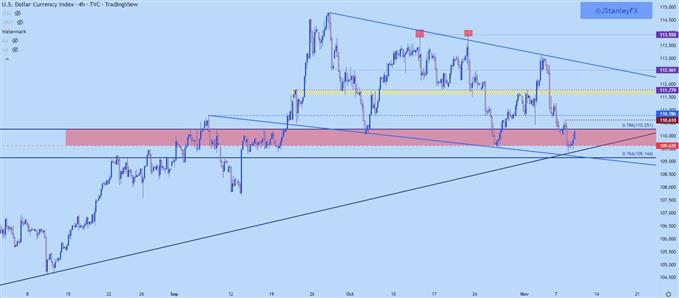
Chart prepared by James Stanley; USD, DXY on Tradingview
USD Daily
From the daily chart we can see that batch of possible support points just below yesterday’s low. There’s a Fibonacci retracement from a long-term setup that plots at 109.14 and there’s the bullish trendline projection that connects late-March and August swing lows. That’s also confluent with another trendline projection that makes up a possible falling wedge formation atop the daily chart.
This falling wedge has the appearance of a bull flag formation, highlighting consolidation that’s shown in the DXY since the collapse-like move in GBP in late-September.
If sellers can punch through that batch of support points, the formation can be invalidated. But, if bulls can force a stronger topside move, the formation can remain alive going into tomorrow’s CPI release out of the US.
US Dollar Daily Price Chart
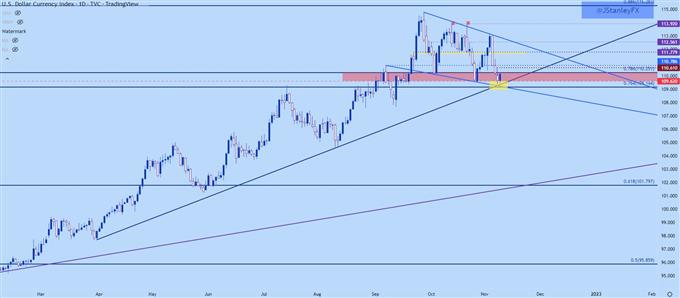
Chart prepared by James Stanley; USD, DXY on Tradingview
EUR/USD
For traders from other markets it can be difficult to comprehend just how important the Euro is to DXY price action. The DXY index was created in 1973 before the world had embarked on full-scale globalization and as such, the index is really concentrated on western economies. It was created before the Euro came into conception so much of this allocation was taken from European currencies like the Deutsche Mark or the Franc of the Peseta.
And when the Euro did become a thing, those allocations were added up and simply re-allocated to one 57.6% block of Euro. There’s a mere 11.9% allocation towards Japan and that’s the sole exposure towards Asian currencies in the index – with no allocation whatsoever towards China.
So, it really is an outdated and lackluster measure of USD value in the marketplace considering that the world’s second largest economy isn’t represented at all.
So, DXY is really overweighted with Euro exposure which helps to explain the profuse bullish trend in the DXY this year, as the Euro was being sold aggressively on a confluence of factors, key of which was the war raging on their Eastern border. That started in February and that’s when the trend in EUR/USD shifted into an entirely new gear. This is represented by the red trendline in the below chart.
EUR/USD Weekly Chart
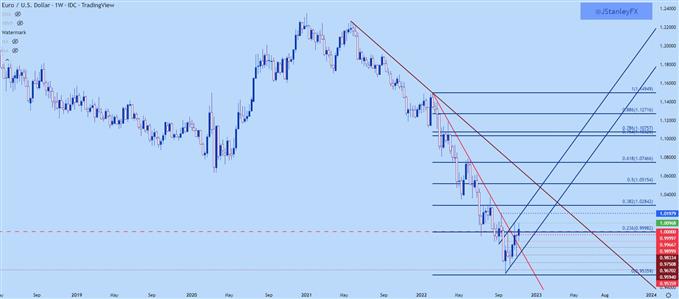
Chart prepared by James Stanley; EURUSD on Tradingview
EUR/USD
This isn’t a meme stock that we’re looking here, nor a cryptocurrency. These are the two largest currencies in the world and frankly, balance is the desired trait. Trends of this nature unsettle economies on both sides of the quote. The weakness seen in the Euro will probably show in inflation data in the coming months. A weaker Euro means imports are more expensive and thusly, prices will increase in response. In the US, a strong US Dollar will make buying exports a much more challenging prospect, and that’s something that will hit American corporates at some point. And that’s not even considering the fast shift in interest rates that probably hasn’t’ even started to show through the data yet considering the Fed’s first rate hike for this cycle was just eight months ago.
But – as I started talking about last month – it seemed as though the blood-letting was taking a pause in EUR/USD. Price had started to build in a series of higher-lows and last week produced a key support test at the psychological level of .9750, which came into play just after FOMC and led to a volleyed move back above the parity handle.
That series of higher-lows has now built into a channel – which sets up a bear flag formation given the proximity where it printed.
Recommended by James Stanley
How to Trade EUR/USD
EUR/USD Daily Price Chart
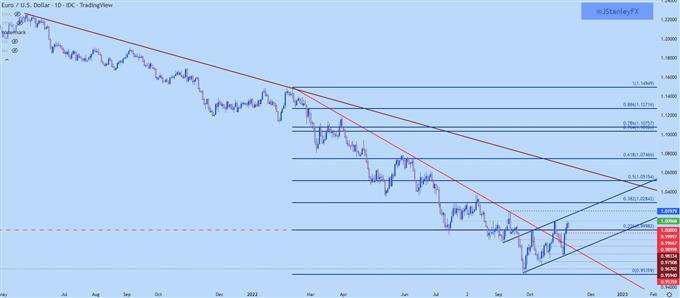
Chart prepared by James Stanley; EURUSD on Tradingview
EUR/USD Shorter-Term: Possible Double Top
When I started to look at the bounce scenario in EUR/USD last month, I looked for prices to pop through parity until finding resistance at a prior swing low around 1.0095. That level ended up marking the high for October trade, and that led-in to the pullback move down to .9750.
But, the quick return to that price – with another resistance inflection there – raises the stakes a bit. First and foremost we have a v-shaped reversal that needs to be respected. There could be some continued bullish activity and that next test of 1.0095 might not get treated so friendly by bears. There’s also a spot to look for higher-low support to work in, taken from prior price swings at resistance of parity or .9950; or perhaps even .9900. All of which would retain higher-low support above that prior swing low of .9750.
But – if sellers can evoke a breach of .9750 before a new high, then we have the fill of a double top formation, and the approximate 350 pips of distance between top and neckline would equate to a projected target of .9400. This would be a violent move as it would not only establish a new low but it would blast through a batch of support points along the way. But – again, this scenario only becomes active on a confirmed breach of that support from last week.
EUR/USD Four-Hour Price Chart
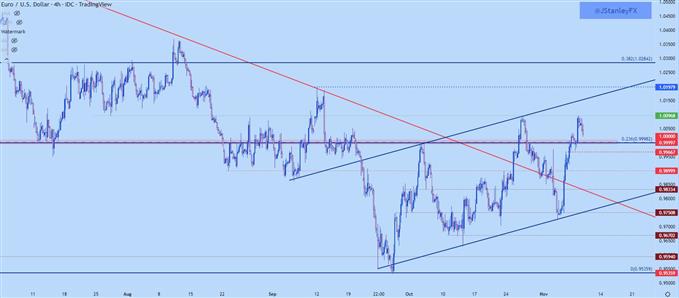
Chart prepared by James Stanley; EURUSD on Tradingview
GBP/USD: Trendline Reaction
I’ve looked at GBP quite a bit of late. Last Thursday’s Bank of England rate decision provided a fresh jolt of fear and it took place the morning after the Fed, so the rubber band got pulled back aggressively on GBP/USD and GBP/JPY trends. But, as I wrote that morning, there was potential for support to show and that’s precisely what showed later in the session, leading into a really strong day on Friday.
I then covered the British Pound as part of our weekly forecasts, but I kept the bias at neutral because it felt like much of the bullish bounce had already priced-in. The charts were messy on Friday when I was putting that piece together, but I think we have a cleaner setup to work with today.
Price has run up to and found resistance at a key trendline projection. This is setting up a possible evening star on the daily chart after yesterday’s spinning top. Price is now back-below the psychologically important 1.1500 level, which from the daily chart, gives the appearance of bearish continuation potential as the late-week rally from last night gets further priced-out.
Recommended by James Stanley
Get Your Free GBP Forecast
GBP/USD Daily Price Chart
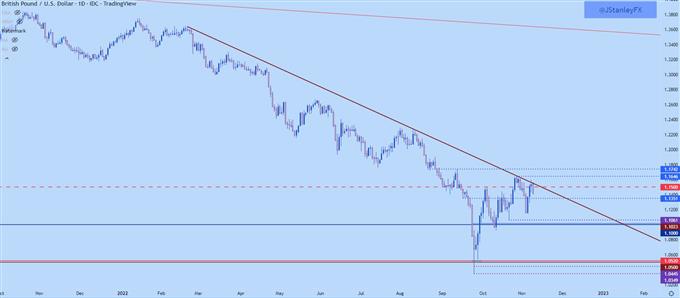
Chart prepared by James Stanley; GBPUSD on Tradingview
GBP/USD Shorter-Term
On a shorter-term basis, that spot of prior support now becomes lower-high resistance potential, and that plots around the 1.1500-1.1550 area. The 1.1350 spot is still important for bears, and a breach below that opens the door for a move down towards last week’s lows around 1.1150.
Recommended by James Stanley
Building Confidence in Trading
GBP/USD Four-Hour Chart
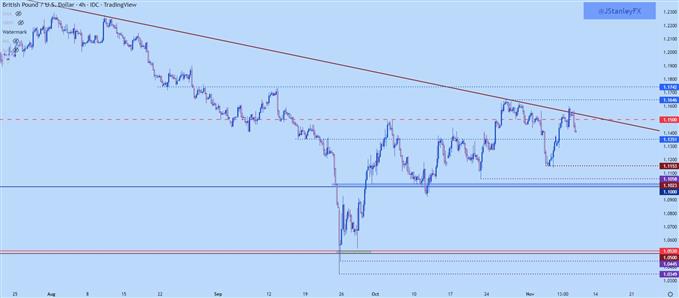
Chart prepared by James Stanley; GBPUSD on Tradingview
USD/CAD
I wrote about the Canadian Dollar yesterday, with a look at USD/CAD showing a short-term descending triangle formation.
Support had built around the 1.3500 psychological level, spanned down to a spot of confluent Fibonacci support around 1.3460. That support gave way shortly after I publish and price pushed down to a fresh monthly low.
But – price action did not revisit that confluent spot at 1.3350 and a pullback has pushed prices right back up to resistance at prior support. This gives the appearance of bearish continuation potential, and it also gives a pretty interesting level to invalidate bearish themes at 1.3500.
USD/CAD Four-Hour Price Chart
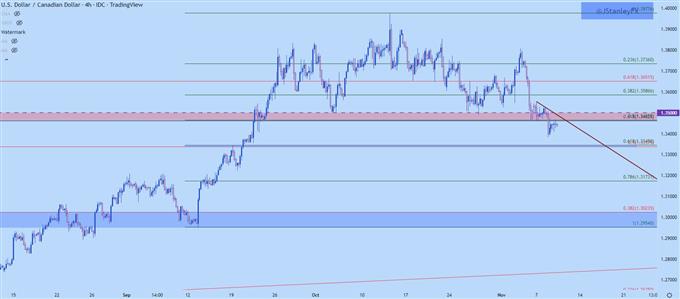
Chart prepared by James Stanley; USDCAD on Tradingview
— Written by James Stanley, Senior Strategist, DailyFX.com & Head of DailyFX Education
Contact and follow James on Twitter: @JStanleyFX
element inside the
element. This is probably not what you meant to do!Load your application’s JavaScript bundle inside the element instead.
www.dailyfx.com