
US Dollar Talking Points:The US Dollar is trading around fresh monthly lows after yesterday’s CPI report. Despite inflation coming in at 8.5%, there
US Dollar Talking Points:
- The US Dollar is trading around fresh monthly lows after yesterday’s CPI report.
- Despite inflation coming in at 8.5%, there was a bit of a reprieve as the data printed inside of expectations and gave hope that inflation may be turning a corner. This helped to remove some pressure from the USD.
- As for DXY direction, the big question is whether EUR/USD can substantiate more of a bullish run. The pair is currently re-testing a major area of resistance at prior support.
- The analysis contained in article relies on price action and chart formations. To learn more about price action or chart patterns, check out our DailyFX Education section.
The US Dollar is continuing to pullback after yesterday’s CPI release. CPI for the month of July printed at 8.5% which is extremely elevated beyond the Fed’s 2% target. But – it was moderation from last month’s 9.1% and even came in below the expected 8.7%. This is the first time in what feels like a long time that inflation started to show some signs of improvement and this has further fed the narrative that the FOMC may be nearing a pause point with rate hikes and policy tightening.
Interestingly, 8.5% is the same CPI print from March, and that brought a far different response as equity markets tipped-over and the US Dollar ran-higher. The difference in impact highlights the expectation component of the matter, as March was seeing inflation continuing to gain and, in August, there’s the hope that inflation has already topped.
As I’ve been discussing of late, trajectory in USD trends is likely contingent on the Euro and EUR/USD’s ability to test through some pretty key resistance. Ahead of the CPI print yesterday, EUR/USD remained in a rectangle formation. That broke out yesterday and there’s a pretty key test taking place at the moment, which I’ll discuss in the EUR/USD section.
USD
There’s additional headline risk on the calendar for tomorrow with the U of Mich Consumer Sentiment reading. Of late, leading indicators like sentiment reports have been big drivers on the fundamental side of the equation so that could be key.
Perhaps the more pressing matter for the USD, however, is the same factor that pushed bulls last week, and that’s Fed-speak. Last week there was a chorus of Fed members opining that rate hikes weren’t yet done and inflation remained a major problem. Well, now that we have a report showing inflation receding, might this bring a softer stance from the FOMC? If so, that could lead to more USD-weakness and equity strength as rate hike bets get priced-out.
But, if we end up with something similar to last week, with the FOMC reminding markets that rate hikes were still on the way until inflation was more adequately addressed, USD-strength could come rushing back.
In DXY, price is trading below the point of last week’s pivot, around the 105.00 level. The next spot of support on my chart is a pivot from the weekly chart, around the 103.86 area which helped to substantiate support in DXY just before the print of fresh highs. This was a pretty strong show of price action support and it remains of interest. And if that can’t hold, there’s a prior point of resistance on the weekly around 103.00 that comes into play.
US Dollar Weekly Price Chart
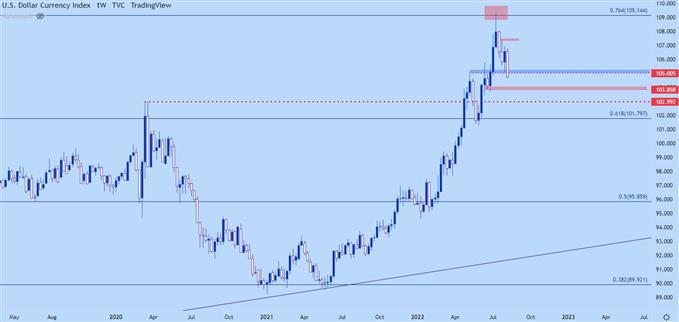
Chart prepared by James Stanley; USD, DXY on Tradingview
EUR/USD
In my opinion, this is where the game is at for USD trends at the moment…
The big question is whether EUR/USD can string together anything more than the quick breakout that showed up yesterday.
After the failure to drive below parity last month, the door was seemingly open for a stronger bounce. After all, if there’s only a couple hundred pips of possible upside (factoring to a parity run), how would the pair pull fresh sellers into the mix, especially considering how elongated the sell-off.
The fact that a strong pullback did not show in late-July and early-August was a very bearish factor, reflecting just how much skepticism continues to revolve around the Euro-zone and the ECB. Even at this stage, there’s a lot of fear, particularly around energy prices ahead of the winter.
Yesterday’s breakout in EUR/USD ran right into a bearish trendline which was confluent with a major spot of prior price action support. That support ran from the 2017 low of 1.0340 up to the May/June low around 1.0350, which set support for a descending triangle formation just before the breakdown.
EUR/USD Weekly Chart: A Major Spot
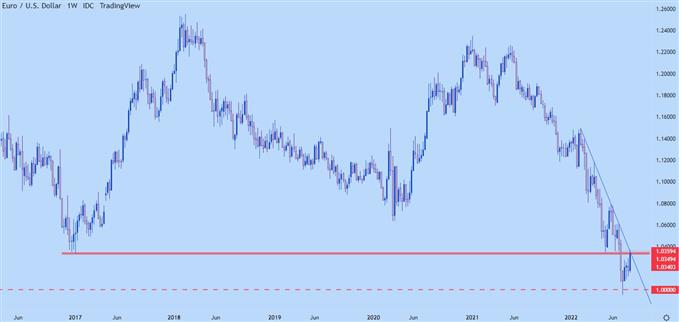
Chart prepared by James Stanley; EURUSD on Tradingview
EUR/USD Shorter-Term
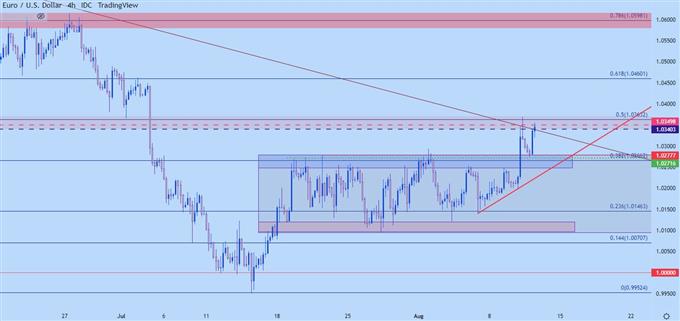
The breakout yesterday ran as high as 1.0369 before prices began to pull back. And even the pull back remained somewhat orderly, with support showing at prior resistance from the range.
So, now we’re set up for round two at resistance. Can bulls break through? If so, the next spot of resistance on my chart is around the 1.0460 level, after which a major spot comes into play around the 1.0600 handle. And, of course, the psychological level at 1.0500 is in between those two prices.
EUR/USD Four-Hour Chart
GBP/USD
GBP/USD was similarly beset by selling into July, crossing the 1.2000 handle which is a pretty important psychological level in the pair, albeit less important than parity in EUR/USD.
But – from those lows began the development of a falling wedge formation, which I started to investigate for bullish reversal potential in the middle of last month. That breakout hit, and prices crossed back above the 1.2000 level while continuing to grind-higher.
That 1.2000-1.2021 area remained notable, and held another support response last week, which also confirmed the support side of another falling wedge formation, which broke out yesterday on the back of USD-weakness.
This pullback overnight found support at a point of prior resistance, plotted around 1.2186, and buyers have since held the higher-low, thereby keeping the door open for bullish continuation themes.
The next point of resistance is the August high at 1.2292, and support structure is at the same 1.2186 or, a bit deeper, around 1.2138.
GBP/USD Four-Hour Price Chart
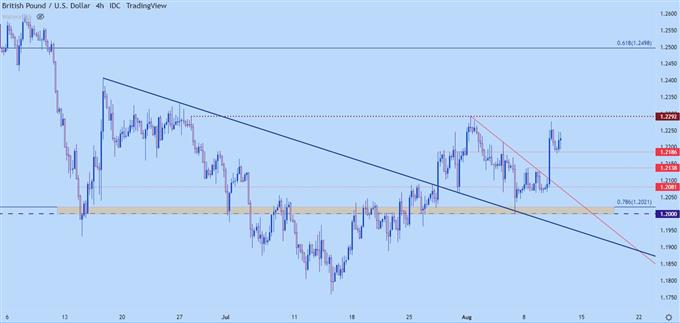
Chart prepared by James Stanley; GBPUSD on Tradingview
AUD/USD
On that topic of falling wedges…
AUD/USD built a similar pattern as GBP/USD above, but on a longer-term scale. An aggressive selloff from the April highs saw the pair lose 1,000 pips. But there wasn’t as much aggression at support or near lows as what had shown near resistance, thereby leading to the build of the wedge… Well, ‘wedges,’ actually, as there were multiple.
The shorter-term falling wedge broke out late last month, and the longer-term formation was broken-through about a week later.
It’s what happened after that breakout that’s interesting.
Prices pulled back after the RBA rate decision last week, finding support at a key spot on the chart. That support held into the end of the week, and now that USD weakness is showing up, AUD/USD is flying higher.
This again illustrates the importance of retaining some element of balance around the US Dollar but it also highlights an option for USD-weakness scenarios.
At this point, prior resistance is support potential and that plots from the psychological level of .7000 up to the Fibonacci level of .7053.
AUD/USD Daily Chart
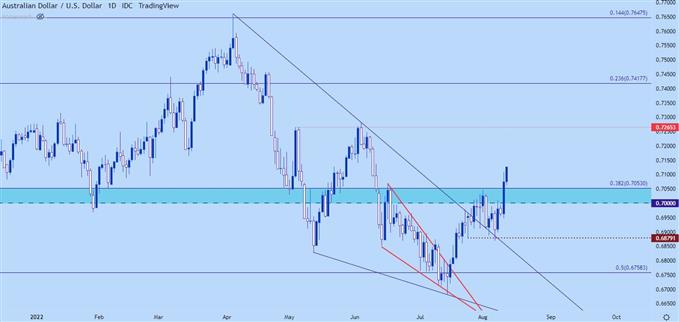
Chart prepared by James Stanley; AUDUSD on Tradingview
USD/JPY
With rates still seeing pullback, so are Yen trends. After last week’s hawkish Fed-speak USD/JPY came back to life, finding resistance at the 135.00 psychological level for four consecutive days before finally succumbing to selling pressure.
As discussed in this week’s forecast, with rates pulling back, carry trades are unwinding and if rates continue in that direction the same could continue to show. So, really, USD/JPY seems like a rate proxy at the moment and for those that are expecting rates to get a boost, support in USD/JPY can be followed around the 131.25 level of prior resistance or, perhaps more notably, around the 130.00 area.
As for direction, I’m not entirely sure at the moment. The bearish move is already well developed and a few hundred pips away from resistance. But we’re also not yet seeing any signs of support playing-in. This is an area where I’d want to wait for more confirmation before looking to work with trends, but given the levels, there is potential for reversal/breakout scenarios for those looking to work with themes around rates at the moment.
USD/JPY Daily Price Chart
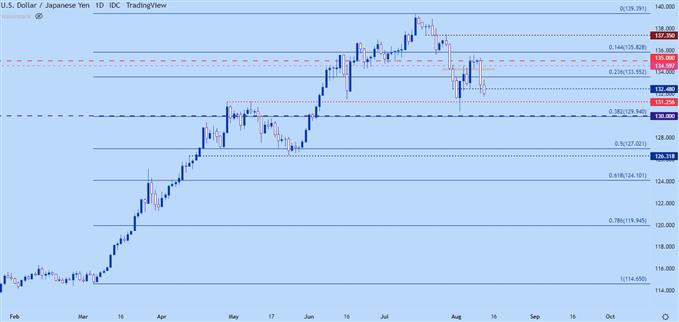
Chart prepared by James Stanley; USDJPY on Tradingview
— Written by James Stanley, Senior Strategist for DailyFX.com
Contact and follow James on Twitter: @JStanleyFX
element inside the
element. This is probably not what you meant to do!Load your application’s JavaScript bundle inside the element instead.
www.dailyfx.com