
DXY, GBP/USD PRICE, CHARTS AND ANALYSIS:
- GBP/USD Looks to Recover with a Trendline Break Pending and UK Labor Data Ahead Tomorrow.
- US Dollar Index Retreat a Welcome for Cable Bulls as Geopolitical Concerns Linger.
- IG Client Sentiment Shows Retail Traders are Net Long on Cable. As We Take a Contrarian View to Client Sentiment at DailyFX, Are We in for Further Downside?
- To Learn More About Price Action, Chart Patterns and Moving Averages, Check out the DailyFX Education Section.
Read More: Bitcoin Breaks Psychological 30k Level as Spot ETF Approval Hopes Grow
Elevate your trading skills and gain a competitive edge. Get your hands on the US Dollar Q4 outlook today for exclusive insights into key market catalysts that should be on every trader’s radar.
Recommended by Zain Vawda
Get Your Free USD Forecast
DOLLAR INDEX (DXY)
The Dollar index has had an intriguing start to the week holding steady in early trade as long-term US Yields helped underpin the US Dollar. However, a significant retreat in US Yields since the start of the US session has seen the DXY make a significant move lower helping risk assets and all dollar denominated asset classes.
Dollar Index (DXY) Daily Chart

Source: TradingView, Chart Created by Zain Vawda
The move in the DXY should not come as a complete surprise given that last week’s threats of escalation in the Middle East failed to inspire a break above the 107.00 mark. This could’ve been seen as a sign that DXY bulls may be growing restless, and a deeper retracement may be needed. The question now is whether this will remain sustainable moving forward?
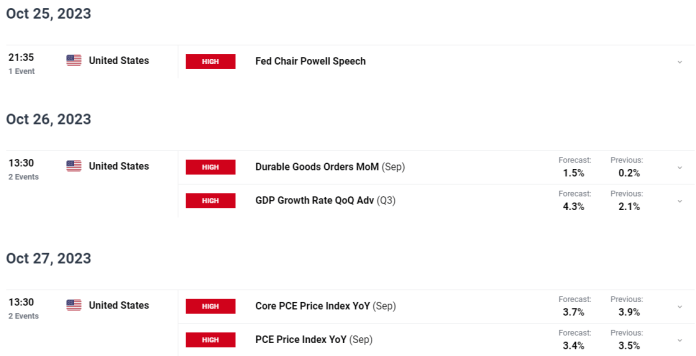
Looking at the rest of the week and it could prove to a tricky one for the DXY as we do have some high impact data events which could provide support for the Dollar. US Q3 GDP is expected to be positive and robust while US PCE Data (Feds preferred inflation gauge) is expected to remain hot. If this is the case, we could be in for a week of two halves, with DXY weakness till Wednesday before a notable recovery to end the week. Definitely worth paying attention to.
Looking for Tips, Tricks and Insight to GBPUSD, Download the How to Trade Guide Below Now!!
Recommended by Zain Vawda
How to Trade GBP/USD
GBPUSD EYEING A TRENDLINE BREAK WITH UK LABOR DATA AHEAD
Cable has been on the backfoot for quite some time with a recent attempt at a rally met with fierce selling pressure on October 12. Now a lot of the pressure on GBPUSD in recent times has been Dollar based and with Dollar weakness today we are seeing a rally at the moment with GBPUSD up around 100-pips at the time of writing.
Tomorrow does bring some UK labor data with positive numbers likely to help Cable continue posting gains. A weak print here could leave the GBP exposed, with a return of USD strength likely to wipe out gains pretty quickly.
The USD still has a key role here as I am not yet convinced that a DXY retracement will last through the week with the US data already discussed. My other concern remains the Geopolitical situation in the Middle East which continues to change every couple of hours. The US have been vocal of military intervention and such a move could give the DXY renewed impetus on safe-haven demand. Please keep a close eye on the developments in the Middle East as it could result in quick changes in risk appetite.

For all market-moving economic releases and events, see the DailyFX Calendar
TECHNICAL OUTLOOK AND FINAL THOUGHTS
GBPUSD is finally approaching the long-term trendline which has been in play since July 14 with Cable having decline about 1000 pips since. It appears the October 4 low may have been a bottom as we have since changed structure by printing a higher high and higher low with today’s rally looking like the beginning of a new higher high leg from a price action standpoint.
If Cable is able to break above the trendline there is the 1.2300 level which could prove sticky with the 50 and 200-day MAs resting just above at 1.2399 and 1.2443 respectively. A break above these two areas could see the long-awaited return to the 1.2500 psychological level.
Alternatively, looking at the potential for a break to the downside and the first hurdle is the recent resistance turned support at the 1.2200 level before the recent higher low at the 1,2100 level becomes an area of interest ahead of the 1.2000 handle. Lots to unpack given the ever-changing market conditions, but opportunities may prove aplenty.
Key Levels to Keep an Eye On:
Support levels:
- 1.2200
- 1.2100 (Recent Swing Low)
- 1.2000 (Psychological Level)
Resistance levels:
- 1.2300
- 1.2399 (50-day MA)
- 1.2500
GBP/USD Daily Chart, October 23, 2023

Source: TradingView, Created by Zain Vawda
IG CLIENT SENTIMENT DATA
IG Retail Trader Sentiment shows that 63% of traders are currently NET LONG on GBPUSD. Given the contrarian view to Client Sentiment data at DailyFX, Is GBPUSD to resume its slide this week?
For a more in-depth look at GBP/USD sentiment and the changes in long and short positioning, download the free guide below.
| Change in | Longs | Shorts | OI |
| Daily | -6% | 21% | 2% |
| Weekly | -10% | 12% | -3% |
— Written by Zain Vawda for DailyFX.com
Contact and follow Zain on Twitter: @zvawda
element inside the
element. This is probably not what you meant to do!Load your application’s JavaScript bundle inside the element instead.
www.dailyfx.com