USD/JPY Analysis and ChartsUSD/JPY is close to 2022’s high of 151.94That in turn was a 30-year topStrong US consumer price numbers could see the Dolla
USD/JPY Analysis and Charts
- USD/JPY is close to 2022’s high of 151.94
- That in turn was a 30-year top
- Strong US consumer price numbers could see the Dollar smash through this again
Learn How to Trade USD/JPY With our Complimentary Guide
Recommended by David Cottle
How to Trade USD/JPY
The Japanese Yen was lower against the US Dollar in Europe and Asia on Monday with USD/JPY set for a fourth straight day of gains and, more pertinently, closing in on 2022’s thirty-year peaks.
The Japanese unit has been battered all year by the Bank of Japan’s disinclination to join in the global round of interest-rate hikes which came in turn as a response to rising inflation. The BoJ’s view has remained that domestic pricing power remains weak and that a response to transitory global factors isn’t appropriate. Indeed, the BoJ disappointed markets at the end of October when its scheduled policy meeting produced no more than a very modest tweak to a long-held program of yield curve control. This aims to keep ten-year local ten-year bond yields capped at an unenticing 1%.
Governor Ueda reportedly told markets he still hadn’t seen enough evidence to feel confident that trending inflation will sustainably hit two percent.”
Cue another hammering for the Yen. The US Dollar is now within a whisker of 2022’s high point of 151.94, a three-decade high. Market focus has now returned to the ‘USD’ side of the pair, with key official US inflation figures due on Tuesday.
Economists expect that headline consumer price inflation will have relaxed to an annualized pace of 3.3% last month, from 3.7% in September. However, the more meaningful core rat which strips out the volatile effects of food and fuel prices is expected to have remained steady at 4.1%.
While as-expected or weaker numbers are likely to cement the view that US interest rates will end the year unchanged, possibly weakening the Dollar, a stronger print could see expectations of further rate hikes quickly priced in, with the greenback then set to surge. Continued Dollar strength against the Yen seems likely in all scenarios though, even if lower inflation data see USD/JPY slip somewhat with other cross-rates.
Gross Domestic Product figures from Japan are also due long after the European market close on Tuesday. While these aren’t likely to garner anything like the attention of the US data, they are expected to be quite weak. If they are, that will weigh further on the Yen,
Recommended by David Cottle
Trading Forex News: The Strategy
USD/JPY Technical Analysis

Chart Compiled Using TradingView
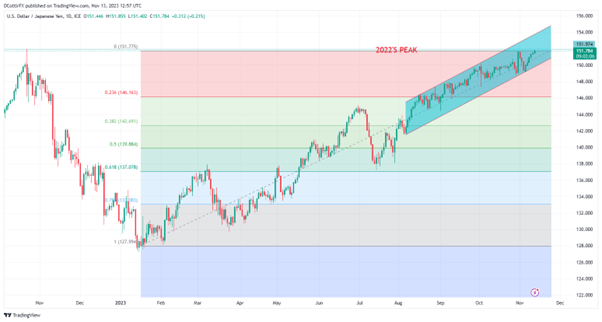
USD/JPY has been rising consistently since mid-January since when the Dollar’s value has risen by an astonishing 29 Yen. The most meaningful current uptrend channel on the daily chart starts from early August, though, with five attempts at the channel top having failed so far. For now, the pair is closer to the channel base but that may simply be explained by some natural caution as that 2022 top at 151.94 nears (at 1330 GMT Tuesday the pair was at 151.77).
It seems highly likely that this week will see a new high made above that level, but it may be more useful to see how comfortable the Dollar looks above that on, say, a weekly closing basis.
Above it, the Dollar bulls will look to challenge the channel top once again. That comes in a good way above the current market at 153.95, a height not seen since mid-1990.
Still, as might be expected, the Dollar is starting to look overbought now, if not yet dramatically so. USD/JPY’s Relative Strength Index comes in at 62.1, high, for sure, but still below the 70.00 level which suggests extreme overbuying.
Reversals are likely to find near-term support at the channel base, currently 149.71, ahead of November 6’s low of 148.89. Should that lower level give way, the focus would then turn to the first Fibonacci retracement of the entire rise up from January 13’s low. That comes in at 146.16, well below this new week’s market.
IG’s own client sentiment indicator finds fully 85% of traders net short at current levels, a number that might argue for a contrarian long-side play.
See How Retail Sentiment Can Affect USD/JPY Price Action
| Change in | Longs | Shorts | OI |
| Daily | 24% | 7% | 9% |
| Weekly | -20% | 19% | 11% |
–By David Cottle for DailyFX
element inside the
element. This is probably not what you meant to do!Load your application’s JavaScript bundle inside the element instead.
www.dailyfx.com

COMMENTS