
Gold Technical Forecast: NeutralIt was a relatively quiet week for gold, all factors considered, with prices holding the same support zone that’s now
Gold Technical Forecast: Neutral
- It was a relatively quiet week for gold, all factors considered, with prices holding the same support zone that’s now been in-play for the past four weeks and five of the past six.
- That support comes in at a critical spot, taken from prior all-time-highs around 1923.70 spanned down to the psychological level at 1900.
- There’s been ample reason for gold to sell-off over the past month but it hasn’t, even with surging US rates and a bullish US Dollar, combined with a number of bearish formations in the precious metal that’ve all been negated so far.
- When the price moves don’t match the headlines and prevailing themes, there’s likely something else going on and this puts even more emphasis on the techs as that can show the next move at a very early stage.
- The analysis contained in article relies on price action and chart formations. To learn more about price action or chart patterns, check out our DailyFX Education section.
Gold prices just spent their fourth consecutive week holding support at a critical spot on the long-term chart, spanning from the prior all-time-high at 1923.70 down to the psychological level at 1900. And spanning back to February, there’s been support in this zone for five of the past six weeks and it had even functioned as resistance before that.
Perhaps more interesting is the bearish potential that’s shown through this period, with an evening star on the weekly and a bear flag on the four-hour, both of which have failed to fill-in as sellers were continually thwarted at this critically important spot on the chart.
And there’s even been some fundamental drive that, normally, would’ve pushed Gold prices lower as both US rates and the US Dollar have surged to fresh highs. But, despite bearish technical and fundamental potential price has just continued to hold this massively important spot on the chart.
Gold Weekly Price Chart
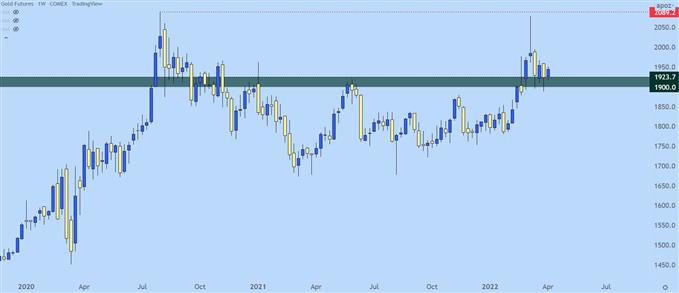
Chart prepared by James Stanley; Gold on Tradingview
Gold Longer-Term
Taking a step back to the monthly chart highlights the importance of this current support. The 1923.70 level was the all-time-high for almost a decade, until the rally in the summer of 2020 finally pierced through the 2k level.
That was around the time that US rates started to tick-higher in a theme that continues to run today. The 10-year had bottomed just before Gold prices had topped in July/August of 2020; and as Treasury yields continued to jump Gold continued to fall through Q1 of last year.
The recent surge in rates, however, has appeared to be a non-factor for Gold prices as the yellow metal has just held that long-term spot of support, even with a number of bearish candle formations appearing over the past month.
Gold Monthly Price Chart
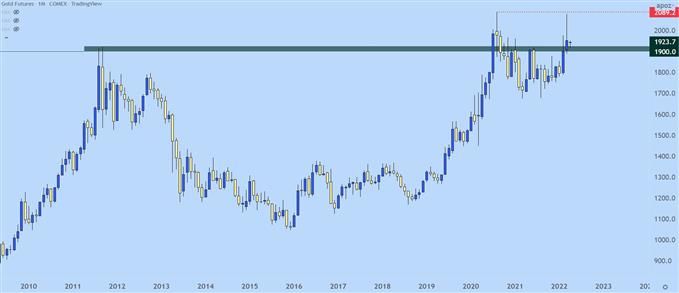
Chart prepared by James Stanley; Gold on Tradingview
Gold Forecast: Neutral, Plotting for Possible Breaks
I still want to view Gold as bearish given this collection of factors but the fact of the matter is that this has been showing for some time already and, at this point, bears haven’t been able to force any meaningful breaks. The surge in treasury yields this week was particularly significant but Gold prices didn’t show much for bearish reaction to that theme.
When something like this shows up, when the backdrop is seemingly bearish but price action is not matching, that usually means that something else is going on and I’m not entirely sure what it is. This may have something to do with risk aversion themes as there’s a number of other peculiarities showing but, I don’t have any evidence of that yet so I have to rely on the simple deduction that something is amiss.
At this point there’s not yet enough bullish indication to institute a bullish technical forecast; however that could be around the corner depending on how gold prices behave over the next couple of weeks. But, perhaps more important than time here is price, with the zone from 1962 to 1967 taking on some importance as this represents the recent range high. A breach of that zone opens the door for another run at the 2k level. On the bearish side of the matter, 1880 remains as relevant, as this was a prior swing-high turned swing-low; and if that’s breached the door is open for another run at the 1850 level.
From that eventual break, we may see some trends develop that could produce some workable setups.
Gold Eight-Hour Price Chart
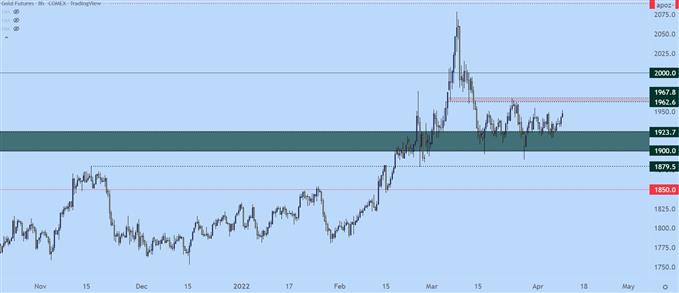
Chart prepared by James Stanley; Gold on Tradingview
— Written by James Stanley, Senior Strategist for DailyFX.com
Contact and follow James on Twitter: @JStanleyFX
element inside the
element. This is probably not what you meant to do!Load your application’s JavaScript bundle inside the element instead.
www.dailyfx.com