
Recommended by Warren Venketas Download the Full JPY Q4 Forecast! Not much has changed from Q3 with the Japanese Yen e
Recommended by Warren Venketas
Download the Full JPY Q4 Forecast!
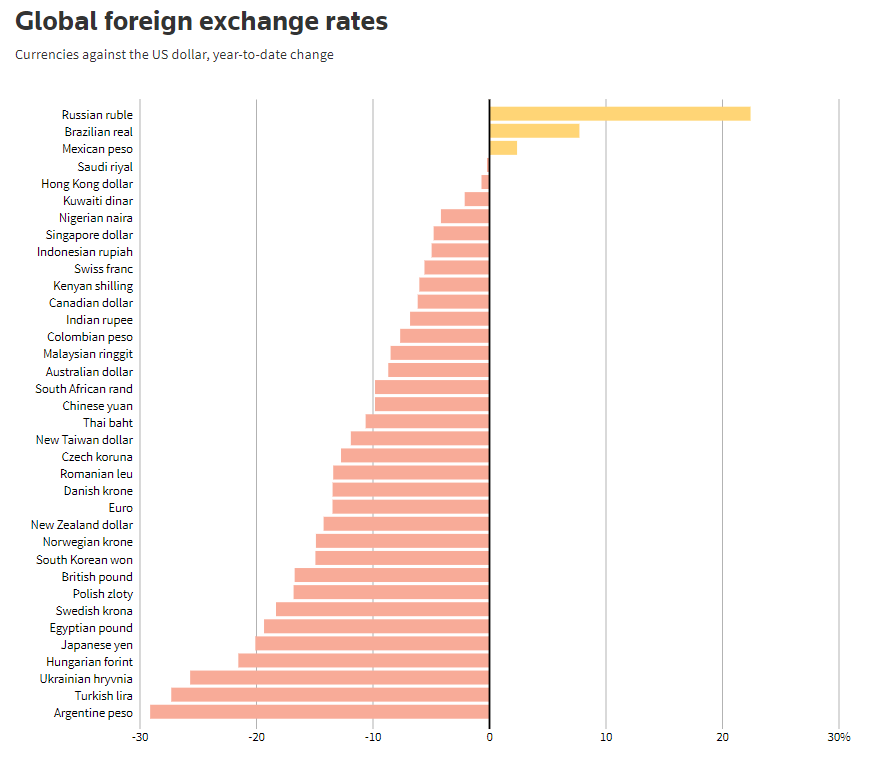
Not much has changed from Q3 with the Japanese Yen extending its weakness against the U.S. dollar as the Bank of Japan (BoJ) continues its dovish stance on monetary policy to stimulate economic growth. Thus far in 2022, the Yen has fallen roughly 20% (see graphic below) against the greenback.
The Yen is the worst performing G10 currency and with Fed tightening set to remain for the remainder of 2022, the Yen may continue to be vulnerable.
Global Currencies Vs. USD Year-to-date
Source: Reuters
The Fed is expected to hike by another 75bps in November with a high probability of another 75bps in December. This leaves much to think about for the Japanese central bank as the rest of the world looks to follow the Fed’s guidance, the BoJ lingers on the opposite side — making imports increasingly costly for Japanese consumers. Upcoming BoJ interest rate decisions will therefore be key – see central bank calendar below:
Central Bank Calendar
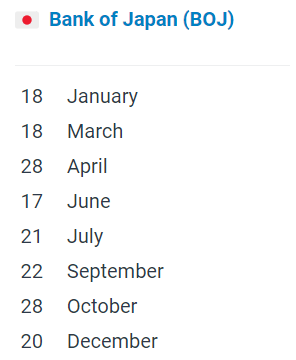
Source: DailyFX Central Bank Calendar
Recent BoJ FX intervention has provided the Yen with some respite through the sale of USD for JPY for the first time since 1998, which may lead to long-term Yen strength once the Fed decides to take its foot off the pedal in 2023. The 145.00 psychological level seems to have been confirmed as the ‘line in the sand’ for the BoJ.
USD/JPY Weekly Chart
Chart prepared by Warren Venketas, IG
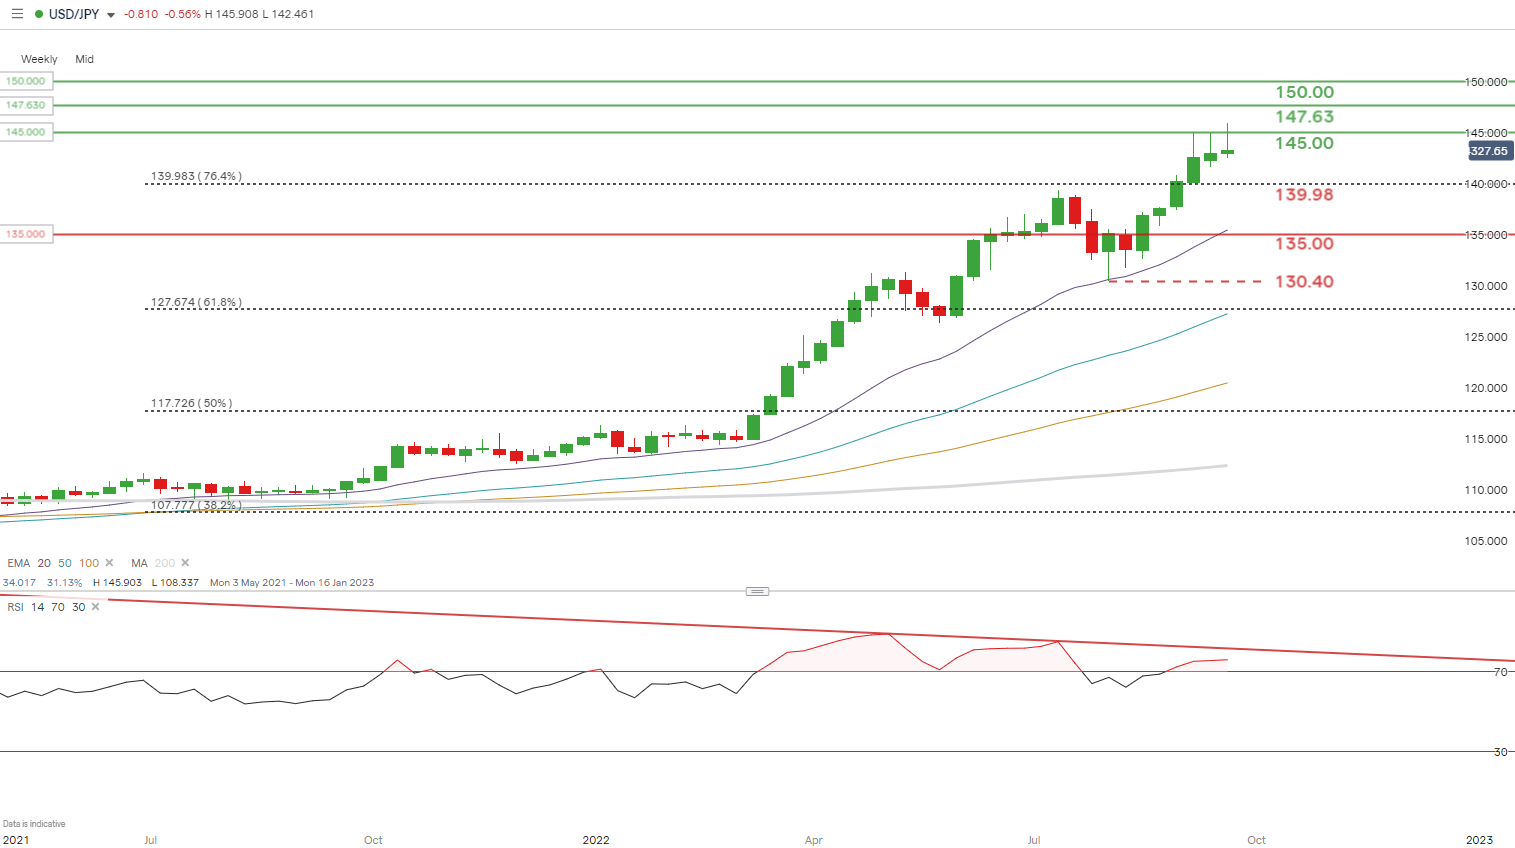
The long-term picture paints the fundamental environment aptly with the exponential rise in the USD/JPY pair for 2022. Levels last seen over 30 years ago are now under threat again should the BoJ hold off in its pursuit of economic stimulation.
Tensions in Ukraine
The RSI displays potential bearish divergence (red) whereby price action opposes the RSI reading. Traditionally, bearish divergence points to an impending reversal to the downside which may be exacerbated by intensifying tensions in Ukraine, attracting investors towards the safe-haven Yen. The current weekly long upper wick supports this notion, but the candle is yet to close (at the time of writing). Should it close in this fashion, we may well see prices move towards 140.00 once more.
USD/JPY Daily Chart
Chart prepared by Warren Venketas, IG
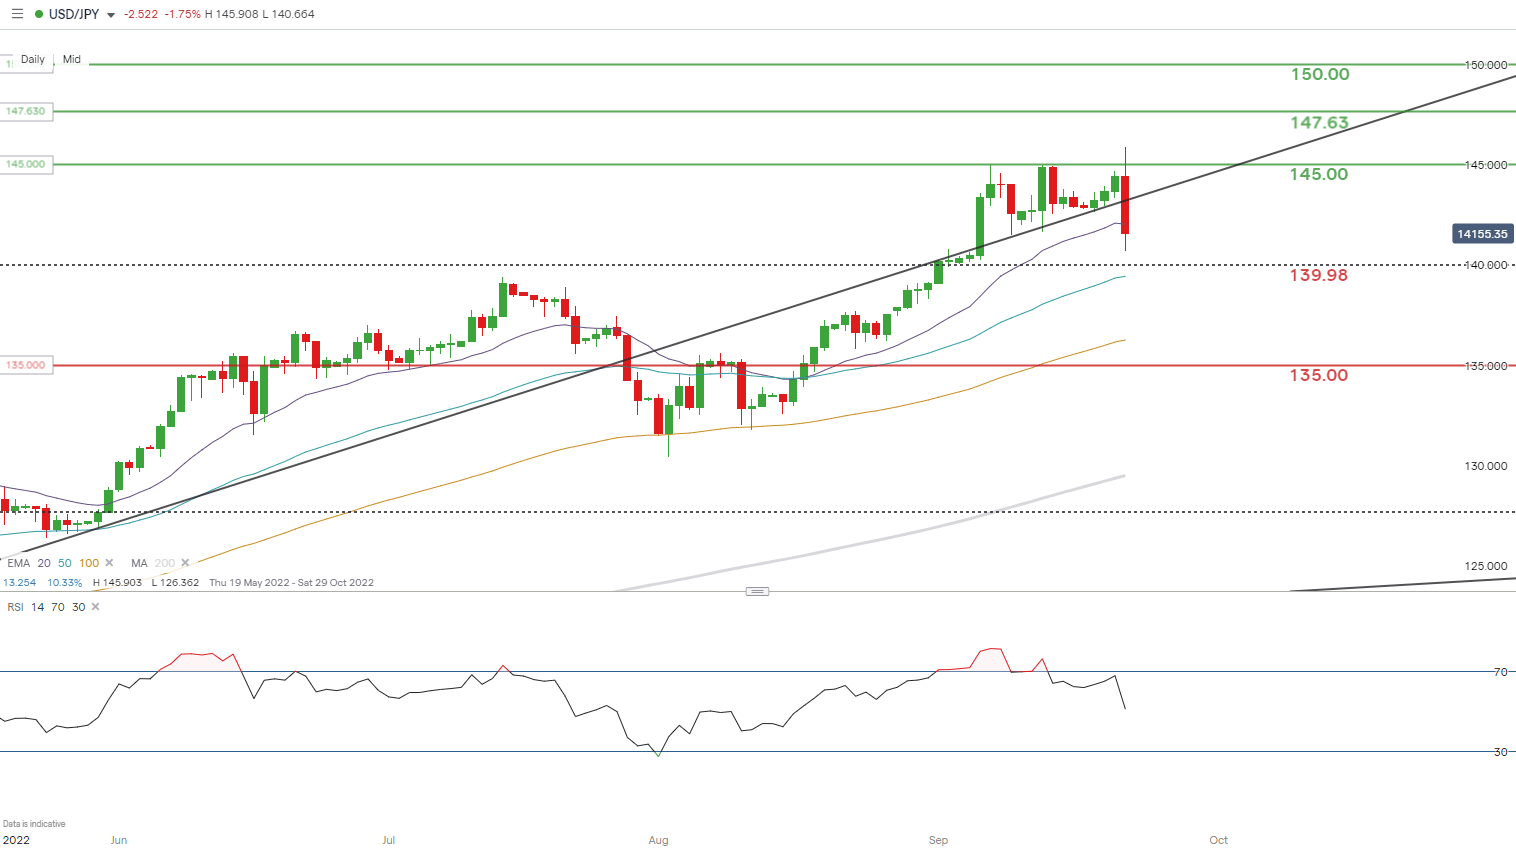
The shorter-term daily chart reflects a similar representation to the weekly outlook. Although topical intervention saw a sharp pullback in USD/JPY, I do not foresee much more in terms of JPY strength based on the current divergent policy narratives from the Fed and BoJ.
Key resistance levels:
-150.00 (last seen in August of 1990)
-147.63 (August 1998 swing high)
-145.00
Key support levels:
-139.98 (76.4% Fibonacci)/50-day EMA (blue)
-100-day EMA (yellow)
Trade Smarter – Sign up for the DailyFX Newsletter
Receive timely and compelling market commentary from the DailyFX team
Subscribe to Newsletter
element inside the
element. This is probably not what you meant to do!Load your application’s JavaScript bundle inside the element instead.
www.dailyfx.com