
Euro talking points:This morning brought the October ECB rate decision and press conference with the European Central Bank hiking rates by 75 basis po
Euro talking points:
- This morning brought the October ECB rate decision and press conference with the European Central Bank hiking rates by 75 basis points.
- The press conference brought bearish outlay from Christine Lagarde and the lack of forward guidance from the bank leaves traders to guesswork as to what the next move from the ECB might be. Lagarde did warn that more rate hikes are coming, but size and scope is unknown. The next ECB policy meeting is December 15th.
- The analysis contained in article relies on price action and chart formations. To learn more about price action or chart patterns, check out our DailyFX Education section.
Recommended by James Stanley
Get Your Free EUR Forecast
EUR/USD was in the midst of its strongest week in four months coming into this morning’s ECB rate decision. The bank was widely expected to hike rates by 75 basis points which they executed on. They also announced a change to TLTROs which are designed to incentivize banks to lend. But with rising rates that policy essentially becomes subsidization to the banking sector and Lagarde announced today that the program would be modified to adjust the rate to the current ECB deposit facility rate. This will effectively increase the cost of borrowing for European banks so, in essence, this is removal of another stimulus tool.
The other large question mark remains unanswered and that’s what the ECB plans to do with the balance sheet. The ECB is currently sitting on an 8.8 trillion Euro portfolio, but Lagarde directed focus for that to the bank’s next rate decision in December.
Regarding rate policy – there’s no forward guidance to go off of here, all we have are simple hints and the claims from Lagarde this morning that more hikes are on the way. This could enable the ECB to be more nimble and with the use of commentary between meetings, similar to Fed-speak, the bank can essentially try to push rate expectations in either direction based on economic conditions. But – and this is a big but – if markets remain skeptical about the ECB’s execution, given that the Fed has been issuing very hawkish forward guidance, this could be a point of vulnerability, particularly considering the importance of the EUR/USD spot quote to the European economy.
EUR/USD
I started looking at the possibility of a deeper pullback in the EUR/USD bearish theme last week, and this was really helped along by a couple of things, key of which was the USD.
The US Dollar had built a double top formation, which is bearish, and that top held through two rather pensive drivers, suggesting that a counter-trend move could be in-play there. That formation in the USD has filled-in already and price has already hit the projected target from the formation at 109.62.
But, given how heavy the weighting of Euro is in the DXY quote (57.6%), it was unlikely that the USD would fall without at least some bullish action in EUR/USD, and that started to show up on Friday.
I looked into the matter again on Monday of this week, and by then EUR/USD had already pushed up for a resistance test at a very key spot on the chart. The .9900 level was confluent with a bearish trendline and as I shared there, a break-above would likely trigger shorts, with more potential for that at .9950 and 1.000 psychological levels. That played out and price ran all the way to my next spot of resistance at 1.0095, which helped to set the high this morning just ahead of the ECB.
During the ECB meeting, prices in the pair pulled back, and even pushed back-below the parity level until support showed up at the Tuesday swing-high, plotted around .9977. That has since led-in to a bounce and this keeps the door open for bullish continuation scenarios as we now have another higher-high that has so far found support at prior resistance, which could be a higher-low.
EUR/USD Two-Hour Chart
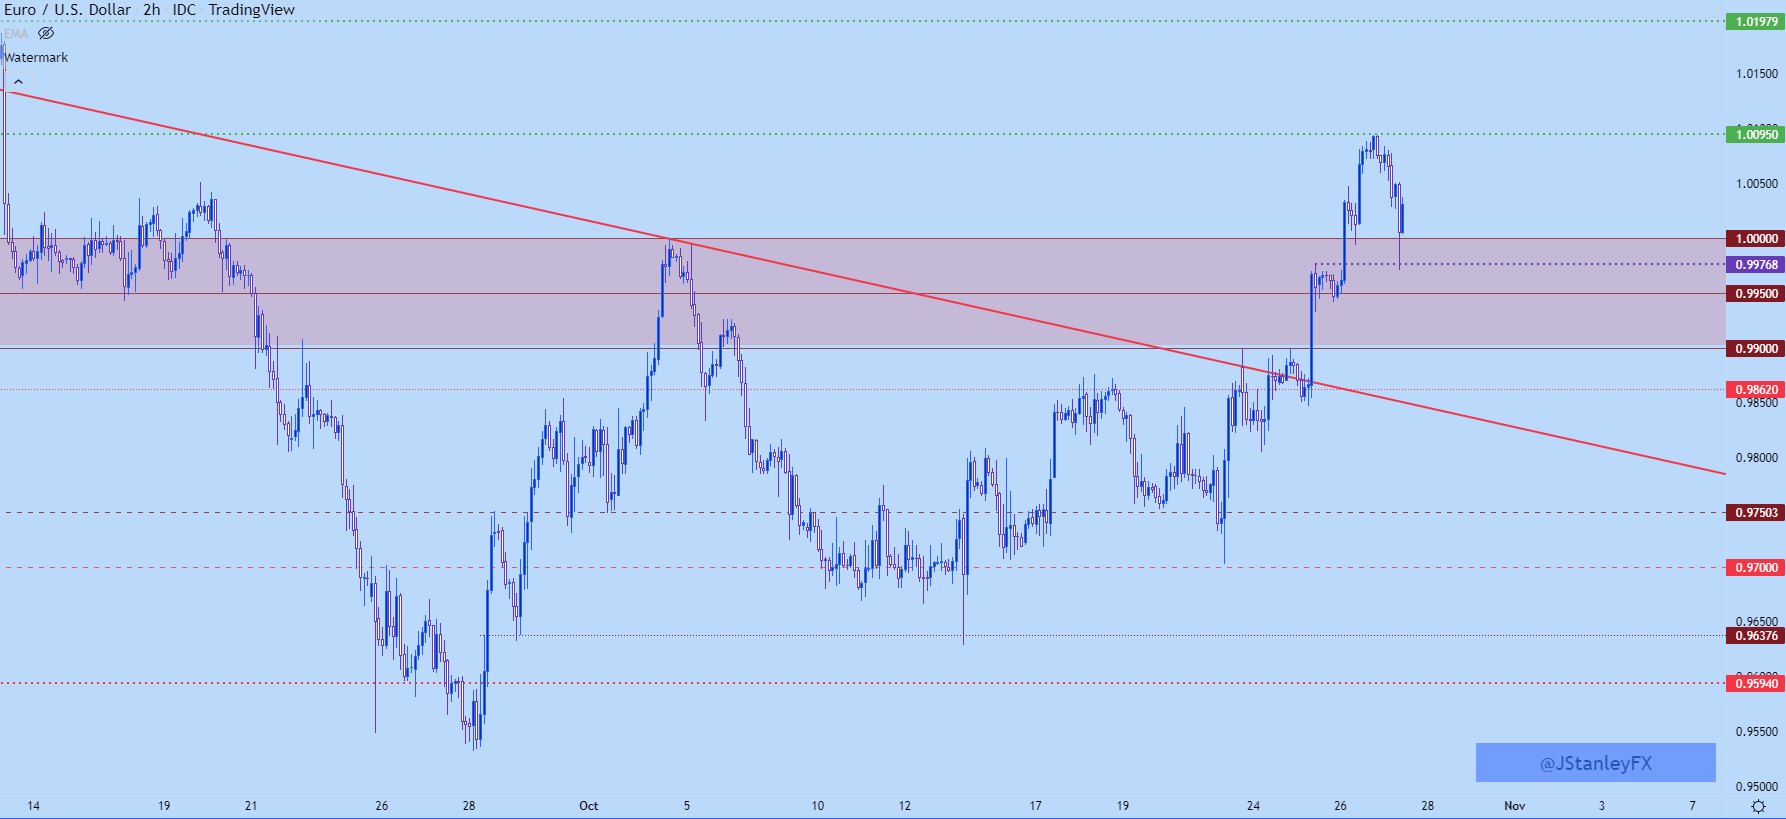
Chart prepared by James Stanley; EURUSD on Tradingview
EUR/USD: Reversal or Pullback?
At this point I’m still of the opinion that this is a short squeeze type of scenario. Given how aggressive the bearish trend has been since February, and given the recent pullback in energy prices with some fear dissipating around Europe’s situation going into this winter, and it made sense that we’d see some counter-trend action and, given how prolonged the move was, that there would be stops lodged above those psychological levels that could lead to a quick momentum-based move as each level came into play.
But, with that said, there could be more room to run on this theme. My next spot of resistance is confluent with the 23.6% Fibonacci retracement of the May 2021 – Sept 2022 sell-off, and that’s at 1.0198; and above that sits a major level of long-term importance at 1.0350, which was the low in 2017 and helped to stall the sell-off this summer from May into August. That would be a major decision point if it can come into play.
And given the drivers on the headline over the next week, we would have to consider such a scenario as a possibility. Tomorrow brings Core PCE, the Fed’s preferred inflation gauge, and next Wednesday brings a highly-anticipated FOMC rate decision.
EUR/USD Weekly Price Chart
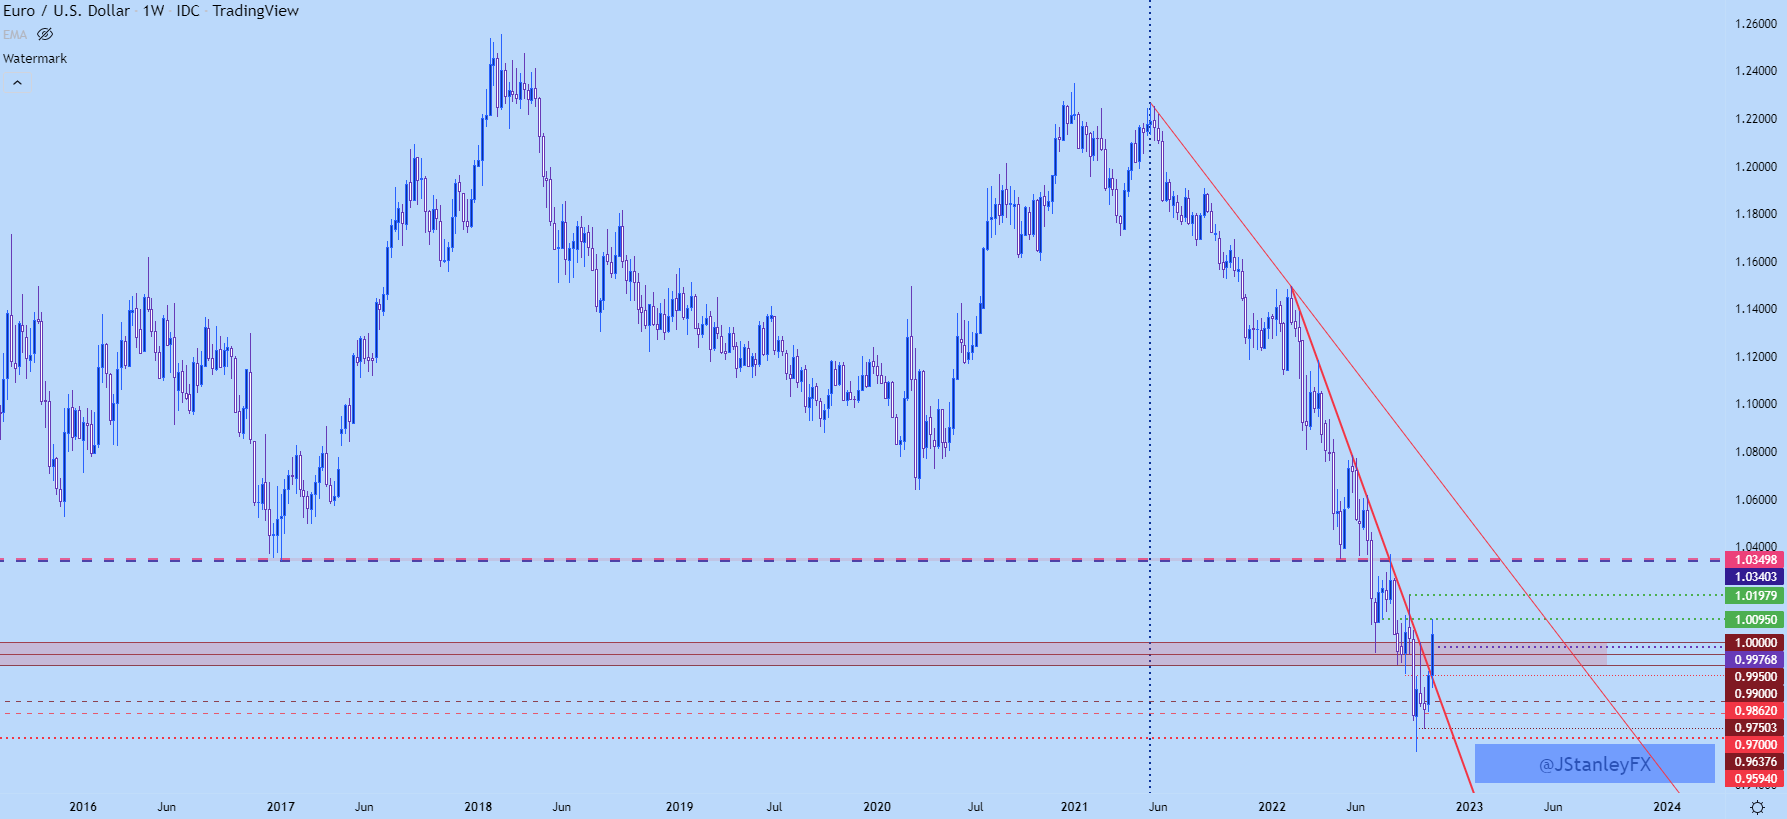
Chart prepared by James Stanley; EURUSD on Tradingview
European Equity
If you listened to Lagarde’s comments during the press conference this morning, there wasn’t much by way of positivity. It seems as though the bank is hiking rates because they have to and as she pointed out multiple times, there’s some significant headwinds in the European economy.
Nonetheless, European equities continue their ascent, as has been the case since last month’s US CPI print on October 13th. I’ve drawn a red trendline on that move on the below chart, highlighting the fast pace of this recovery even as data has remained pretty dim.
As highlighted by our own Tammy Da Costa yesterday, the DAX had even started to test some key longer-term resistance, as taken from the topside of a falling wedge pattern.
Buyers forced a break through that pattern this morning and the index is now trading at a fresh monthly high.
DAX Two-Hour Chart
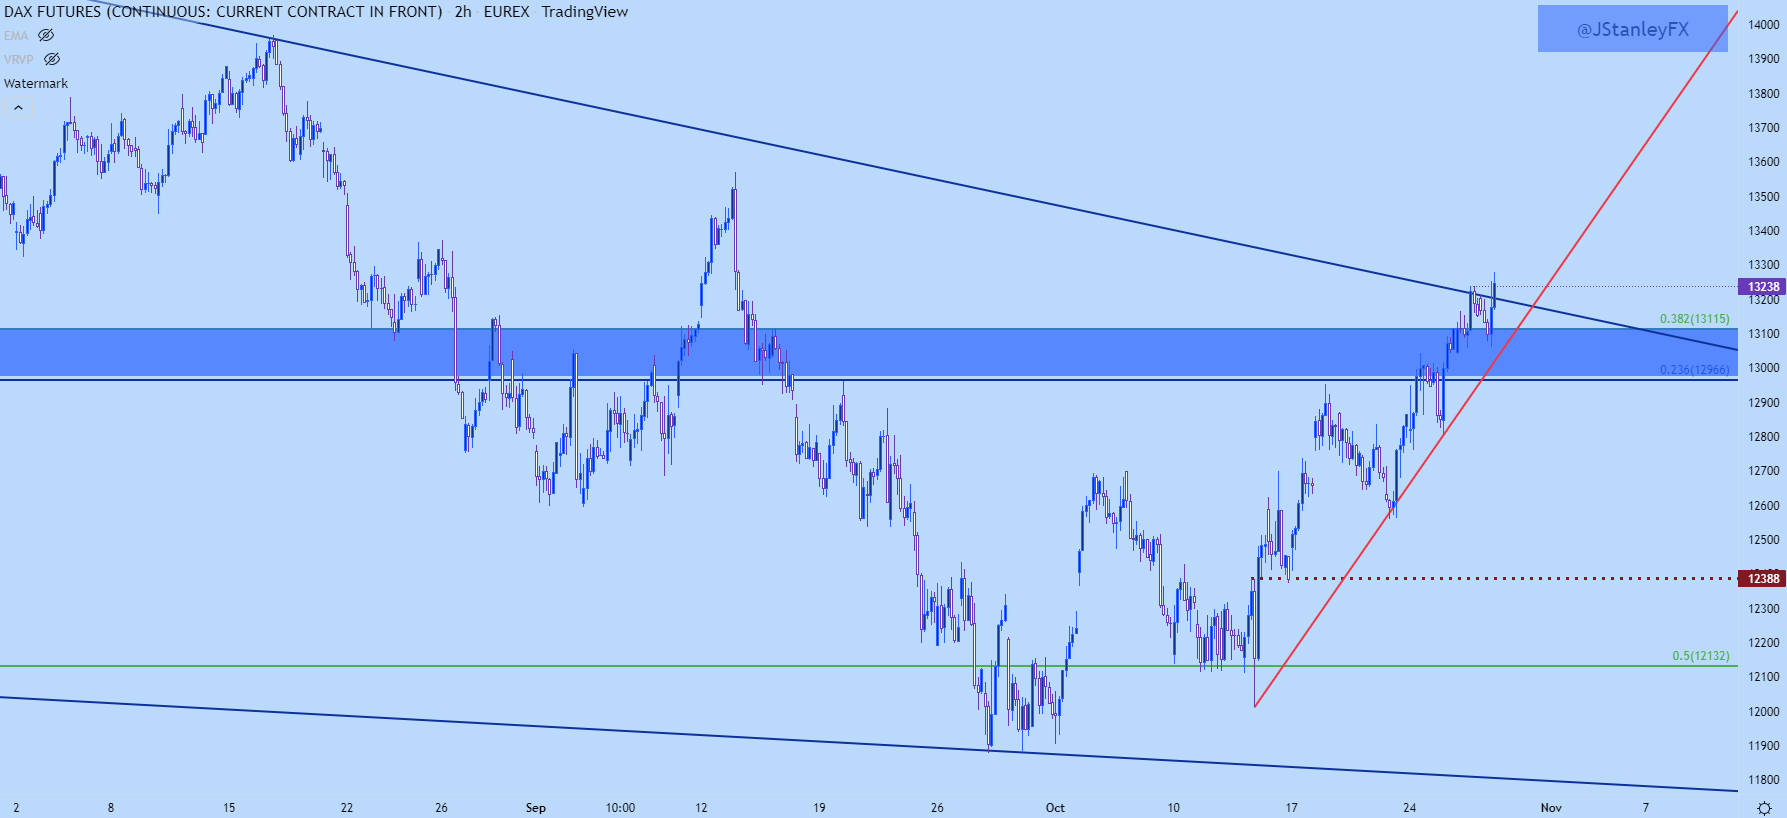
Chart prepared by James Stanley; DAX Futures on Tradingview
DAX Falling Wedge
Falling wedges are often tracked for bullish reversal potential. The logic is such that, sellers are trepidatious around lows or at support, while remaining aggressive at highs or near resistance, and this is something that may be the early sign of bearish pressure slowing. After all, if sellers were really aggressive, they should be punching down to fresh lows after support comes into play, right? And if they’re not, there’s probably a reason for that.
Looking at this from the weekly chart shows that we’re just now starting that test, even with the intra-day breach above that level and the index has already put in a powerful move from the lows of just a few weeks ago, currently showing at just under 12%.
So, chasing here could be of challenge, but a continued push from bulls could re-open the topside theme. It’s difficult to justify a bullish stance from a fundamental point of view, but that’s been the case for the past month and that hasn’t stopped buyers from continually pushing the envelope. So, when in those situations, best to track price until evidence of reversal comes into play.
DAX Weekly Chart
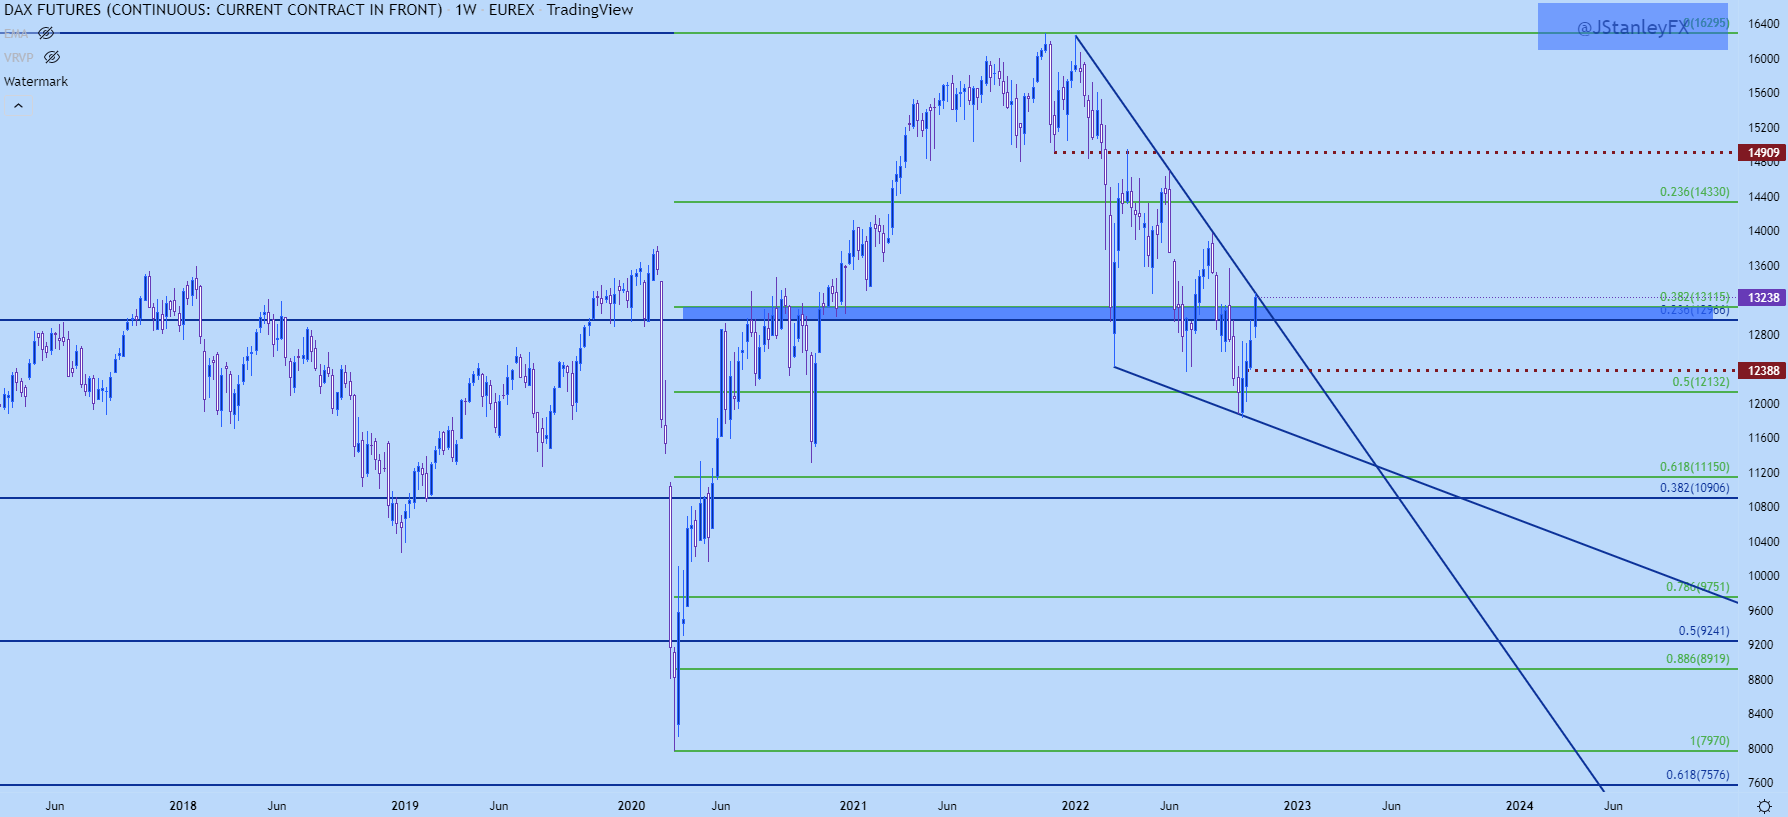
Chart prepared by James Stanley; DAX Futures on Tradingview
DAX Near-Term Levels
At this point, there’s a large zone of confluence that can act as support and it’s been resistance already at a few different points. This runs between Fibonacci levels at 12,966 and 13,115. If sellers can pose a reversal through that level, we could soon have bearish scenarios back in the picture, but I’d be cautious on that front until we have confirmation.
For next resistance levels, I’m tracking prior price action swings at 13,447 and 13,572. If those come into play, we’ll have a more confirmed break of the longer-term wedge, thereby adding to the bullish nature of the move that we’ve seen over the past few weeks.
DAX Daily Chart
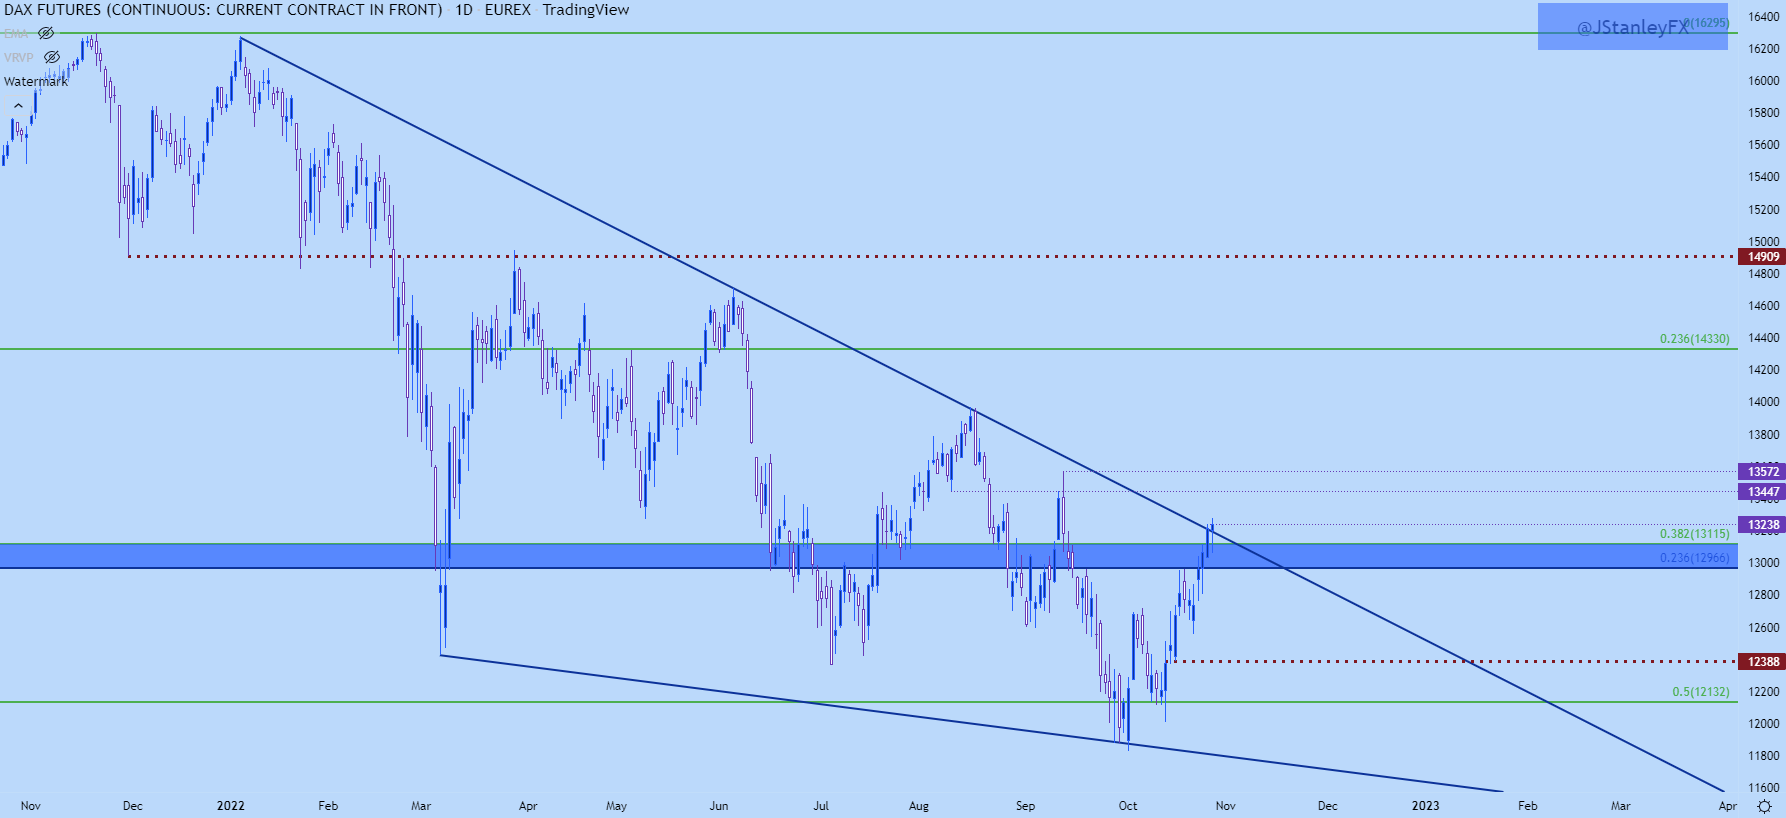
Chart prepared by James Stanley; DAX Futures on Tradingview
— Written by James Stanley, Senior Strategist, DailyFX.com & Head of DailyFX Education
Contact and follow James on Twitter: @JStanleyFX
element inside the
element. This is probably not what you meant to do!Load your application’s JavaScript bundle inside the element instead.
www.dailyfx.com