
Japanese Yen, JPY, USD/JPY, AUD/JPY, CAD/JPY Talking Points:The Japanese Yen has been on an astounding run of weakness over the past two weeks, with
Japanese Yen, JPY, USD/JPY, AUD/JPY, CAD/JPY Talking Points:
- The Japanese Yen has been on an astounding run of weakness over the past two weeks, with multi-year highs printing in all of USD/JPY, AUD/JPY and CAD/JPY.
- The big question is why and the only logical rationale is central bank divergence, with the Bank of Japan sitting on weak and loose monetary policy as other economies gear up for rate hikes to fight inflation. As rates run in USD, CAD or AUD, the attractiveness of carry trades increase against the low-rate Yen, and that can further push the topside in those pairings. This is the same theme that was in play in Q1 and Q4 of last year but with even more emphasis.
- The analysis contained in article relies on price action and chart formations. To learn more about price action or chart patterns, check out our DailyFX Education section.
The Japanese Yen continues to get hammered and breakouts in a number of JPY pairs have pushed up to fresh multi-year inflection points. The big driver appears to be continued central bank divergence, with the Fed gearing up for as many as five or six more hikes this year and many other central banks also looking to hike rates to buffer inflation. Meanwhile the Bank of Japan doesn’t look to be anywhere near the same scenario and this has made the attractiveness of carry trades that much more alluring.
This is very similar to a theme that we looked at in Q1 of last year and again in Q4, right around the time that Powell and the Fed started to warm markets up for rate hikes in 2022. At that September 2021 rate decision, the Fed pointed to just one hike for 2022. But markets were pretty sure that wouldn’t do the trick and USD strength continued to advance in anticipation of a greater hawkish shift at the Fed.
That showed in November when Jerome Powell was up for re-nomination atop the Fed. At his confirmation hearing, he even said that the bank wanted to retire the word ‘transitory,’ which they had used to ignore inflation throughout last year. This only increased the expectation for a more-hawkish Fed and that’s grown even more since then.
The breakout in USD/JPY has been astounding. I last looked at JPY setups two weeks ago before the breakout began to show, and the topside move has been beyond my expectations.
USD/JPY Four-Hour Price Chart: Ascending Triangle Breakout
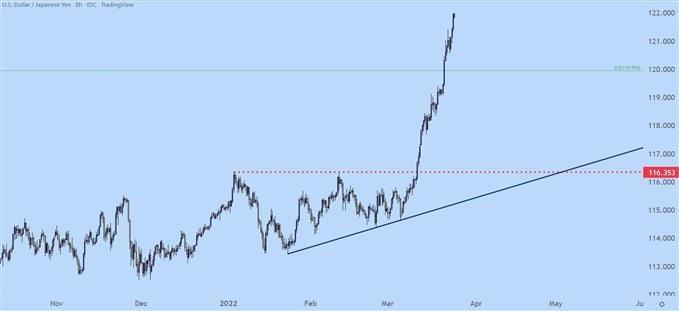
Chart prepared by James Stanley; USD/JPY on Tradingview
USD/JPY Longer-Term
Perhaps most impressive is how this move looks on the longer-term chart of USD/JPY. From the monthly below, we can see price action finally resolving above a batch of resistance that’s been in-play for some time. And the momentum shown on this monthly bar harkens back to 2012 or 2014, when Abe-nomics was driving Yen-weakness across the FX-complex.
If we are on the cusp of another of those trends, which was similarly driven by central bank divergence, we could all be in for a very fun summer in the Forex market.
USD/JPY Monthly Price Chart
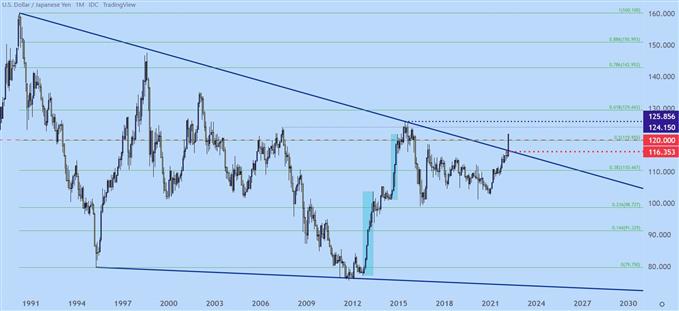
Chart prepared by James Stanley; USD/JPY on Tradingview
AUD/JPY
While the USD has been range-bound for much of March, the Australian Dollar has continued to show strength. I’ve been favoring AUD over USD of recent, largely on the performance of AUD/USD which appeared to bottom in February.
But that additional AUD strength has been on full display in AUD/JPY, as well. The historical connotations aren’t as profound as what we’re seeing in the major of USD/JPY, however.
When I last looked at AUD/JPY a couple of weeks ago it was working on a possible breakout beyond the 85.00 psychological level. It had a similar ascending triangle theme that was brewing at the time, and that formation has resolved with an aggressive topside move. At this point, it’s already taken-out the 90 handle, too, on its way to a fresh 6.5 year high.
Chasing here could bring challenges as the move is overbought; but there is some support potential around the 90 big fig should a pullback develop. And while that level is more than 150 pips away from current market prices, it’s important to remember that when volatility increases that can work on both sides of the matter, pullbacks as well as impulse moves.
AUD/JPY Weekly Price Chart
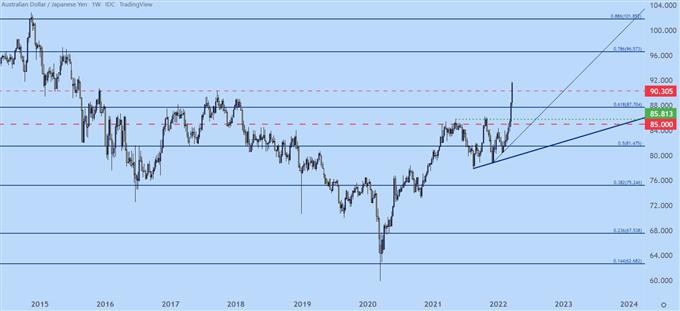
Chart prepared by James Stanley; AUD/JPY on Tradingview
CAD/JPY on a Streak
CAD/JPY is currently working on its 12th consecutive daily gain. From short-term charts, this appears to be a stratospheric run. And given the oil exposure from the CAD combined with JPY weakness, there’s even some fundamental backdrop for this move to have built.
The concern here would be longer-term as prices are now venturing into a prior spot of support. This makes me even more cautious around chasing the theme higher as prices are now overbought and venturing into longer-term resistance potential. There’s also the psychological 100 level in that neighborhood, adding to that context.
CAD/JPY Monthly Chart
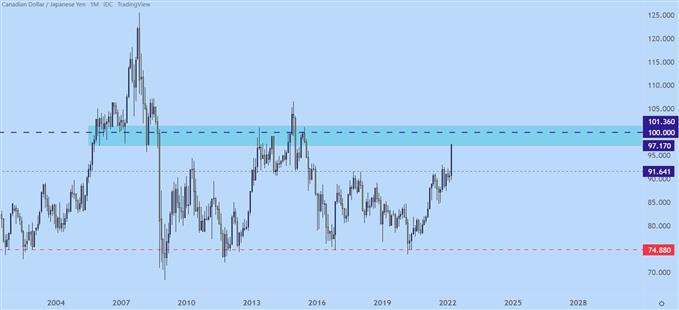
Chart prepared by James Stanley; CAD/JPY on Tradingview
— Written by James Stanley, Senior Strategist for DailyFX.com
Contact and follow James on Twitter: @JStanleyFX
element inside the
element. This is probably not what you meant to do!Load your application’s JavaScript bundle inside the element instead.
www.dailyfx.com