S&P 500 & GOLD PRICE FORECAST:Gold (XAU/USD) Struggles as Sentiment Improves. Will a Sustainable Move Above $2000/oz Materialize?S&P 500 E
S&P 500 & GOLD PRICE FORECAST:
- Gold (XAU/USD) Struggles as Sentiment Improves. Will a Sustainable Move Above $2000/oz Materialize?
- S&P 500 Ended Last Week Down 10% from the YTD High. This is Usually Seen as a Correction.
- A Host of Earnings and Data Releases Lie in Wait. Will the Earnings and Data Releases be Able to Overshadow the Geopolitical Risks and Drive Market Moves This Week?
- To Learn More About Price Action, Chart Patterns and Moving Averages, Check out the DailyFX Education Section.
Most Read: Euro Weekly Forecast: EUR/USD, EUR/JPY Remain Vulnerable Following Lackluster ECB Meeting
The S&P 500 looks set to arrest its slump today as safe-haven appeal takes a breather and traders focus on a host of data events later this week. The tension in the Middle East threatened to boil over heading into the weekend. However, the ground offensive by the Israeli military turned out to be less than first feared which appears to have helped risk sentiment.
Download the complementary US EQUITIES Forecast for Q4 Now!
Recommended by Zain Vawda
Get Your Free Equities Forecast
Earnings at the back end of last week remained largely positive with no significant misses except the already discussed Alphabet cloud business. McDonald’s released earning this morning and surprised with a beat thanks in part to new products and low pricing keeping customers coming back for more.
On Friday the S&P had lost around 10% from the July high which is key as a dop of 10% in equity markets is usually viewed as a correction. Buying pressure has returned since but whether or not it will be sustainable will be something to watch as the week unfolds.
S&P 500 Losses from the July High Exceeds 10%- Correction?

Source: TradingView
S&P 500 TECHNICAL OUTLOOK
Form a technical perspective, the S&P failed to reach the 4000 mark as discussed last week with a pullback today. However, we are seeing a bit of selling pressure returns as we head deeper into the US session. The S&P as mentioned earlier has fallen 10% from the YTD high in what is usually considered a corrective move. This could also in part be the reason for the buying pressure while sellers may also be cashing in ahead of heavy data releases later in the week.
In what could be viewed as an ominous sign is the approach of a potential death cross formation as the 20-day MA looks to cross below the 200-day MA. This would be a nod to the strength of the downtrend as well as provide sellers with a bit more optimism for further declines. Now I am not sure if this will happen before the FOMC meeting, and we could remain rangebound till the meeting is out of the way.
Key Levels to Keep an Eye On:
Support levels:
Resistance levels:
S&P 500 October 30, 2023

Source: TradingView, Chart Prepared by Zain Vawda
GOLD OUTLOOK
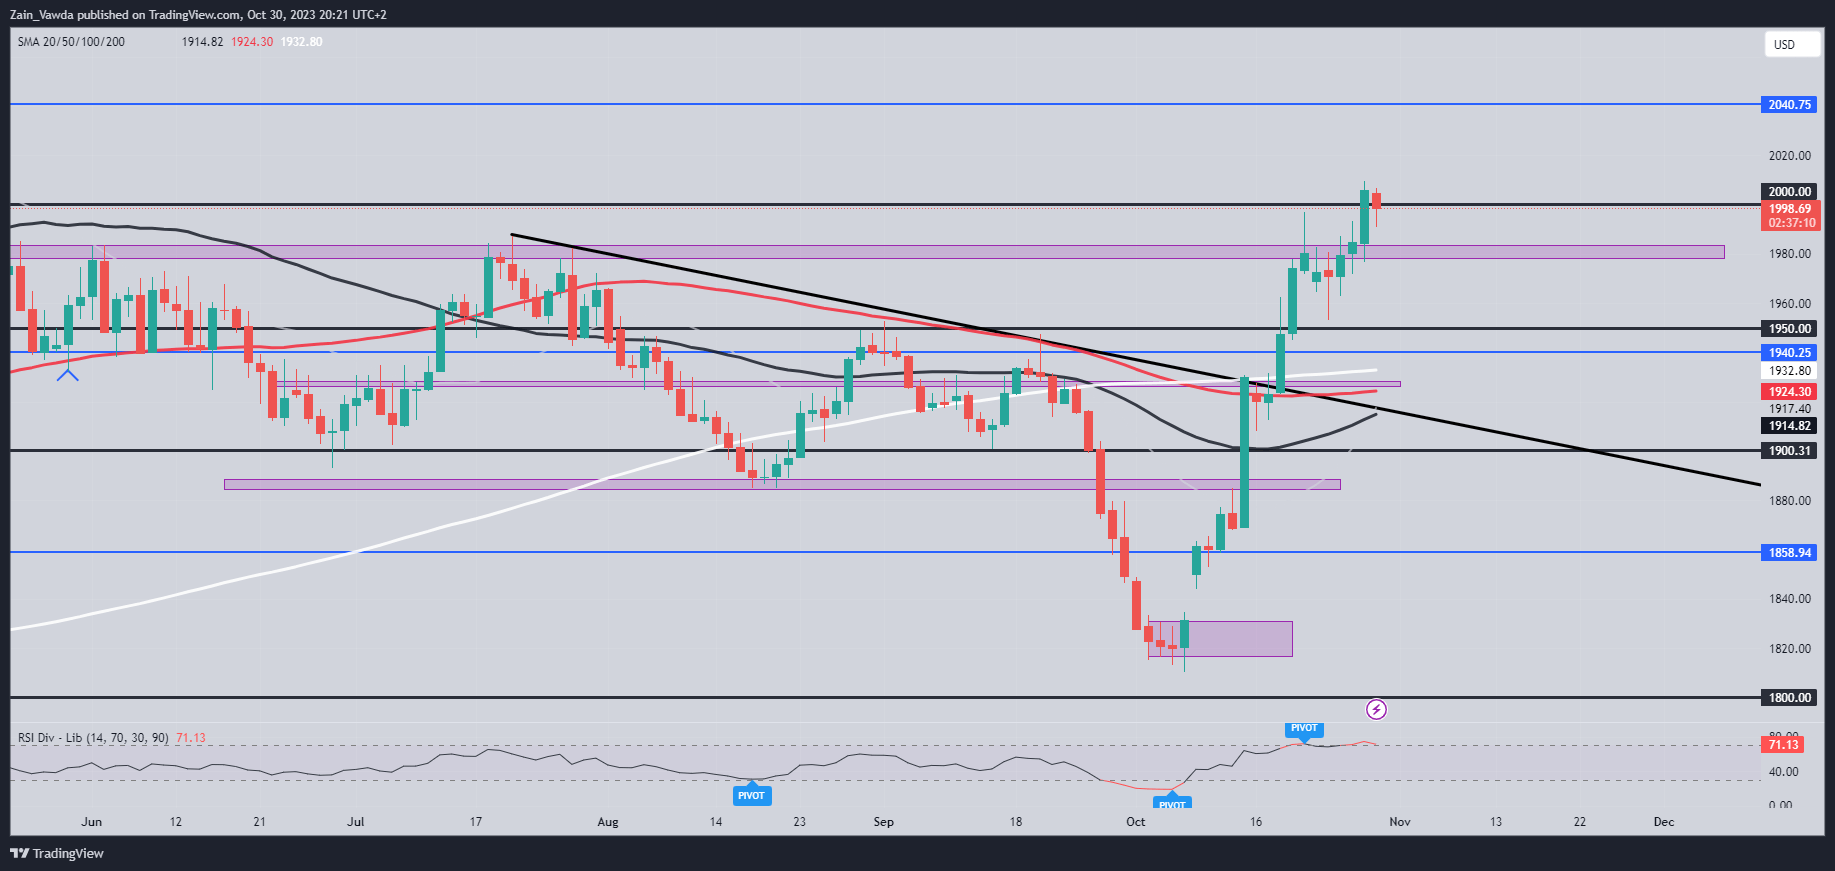
Gold for its part enjoyed buying pressure late into the US session on Friday as news came through that Israel would begin a ground offensive. Safe-Haven appeal clearly helping the precious metal end the week on a high.
As mentioned, we are seeing a slight improvement in sentiment to start the week which has seen Gold flirt with the $2000 mark. If the bullish rally is to continue, we do need acceptance above the $2000 mark. The situation in the Middle East remains the key driver for Gold prices ahead of the FOMC meeting on Wednesday and without any surprise from the Fed could continue to drive prices for the foreseeable future.
A lot of data ahead this week coupled with the continuation of US earnings season. Market participants appear to be adopting a cautious approach heading into the FOMC meeting on Wednesday as doubts linger around another rate hike from the Central Bank.

For all market-moving earnings releases, see theDailyFX Earnings Calendar
IG CLIENT SENTIMENT
Taking a quick look at the IG Client Sentiment, Retail Traders are currently LONG on Gold with 60% of traders holding LONG positions. Given the contrarian view adopted at DailyFX when it comes to client sentiment, is Gold on its way back toward the $1980 support area?
Gold (XAU/USD) October 30, 2023

Source: TradingView, Chart Prepared by Zain Vawda
Key Levels to Keep an Eye On:
Support levels:
Resistance levels:
For a more in-depth look at Client Sentiment on Gold and how to use it download your free guide below.
| Change in | Longs | Shorts | OI |
| Daily | 13% | 5% | 10% |
| Weekly | -3% | 2% | -1% |
Written by: Zain Vawda, Markets Writer for DailyFX.com
Contact and follow Zain on Twitter: @zvawda
element inside the
element. This is probably not what you meant to do!Load your application’s JavaScript bundle inside the element instead.
www.dailyfx.com

COMMENTS