
US Dollar Talking Points:The US Dollar has hit yet another fresh yearly high, and this time it wasn’t funded in large part by a meltdown in the Japan
US Dollar Talking Points:
The US Dollar has hit yet another fresh yearly high, and this time it wasn’t funded in large part by a meltdown in the Japanese Yen. The most recent iteration has come at the expense of both the Euro and the British Pound which continue to sell-off, albeit to varying degrees of momentum.
In the US Dollar, the currency traded above the 102.00 figure in DXY for the first time since March of 2020. This also marks the entrance into a long-term zone of resistance that I have starting around 101.80. This is a resistance zone with some longer-term consequence that’s helped to hold the highs in the Greenback for almost 20 years now.
But, from the weekly below, we can see the US Dollar working on its fourth consecutive week of gains, through the entirety of early-Q2 trade. We kept the forecast as bullish for the USD this quarter, looking for a move into this longer-term zone. If you’d like the full forecast, you can access that from the below link.
US Dollar Weekly Price Chart
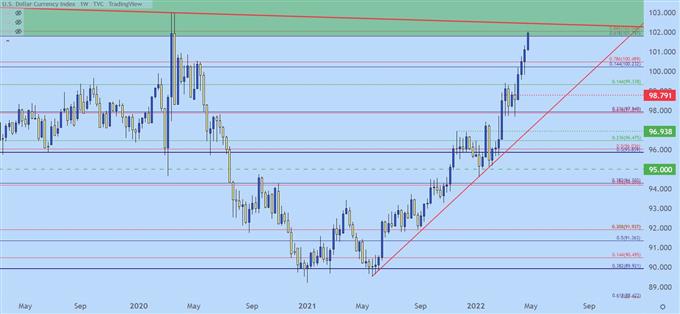
Chart prepared by James Stanley; USD, DXY on Tradingview
Taking a step back to the Monthly chart and we can see the current bar in the US Dollar has forced a sizable jump. You’ll also notice that prior iterations in this zone were quickly met with reversals, as indicated by the upper wicks on those episodes from 2016/2017 and again in 2020.
This run, however, has seen no softening as buyers are continuing to push. And counterparts appear to be helping with Euro and GBP sinking even as the Yen starts to strengthen, with the USD jumping throughout the development of all of those themes. This also sets up for a very interesting backdrop as we move deeper into Q2 trade. On the other side of this resistance zone is fresh 20-year highs in the USD.
US Dollar Monthly Price Chart
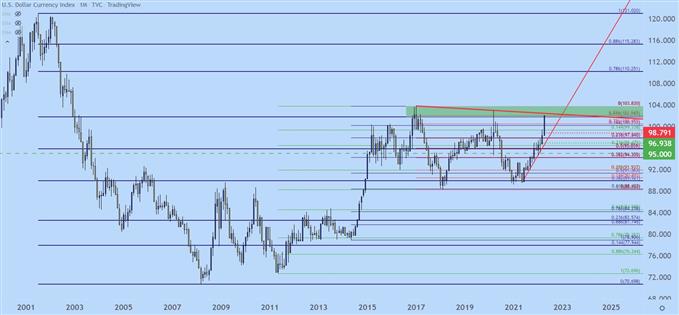
Chart prepared by James Stanley; USD, DXY on Tradingview
EUR/USD Fresh Two Year Lows
EUR/USD has already set fresh two year lows and there’s one more waypoint on the way down on the chart, and that’s the Covid low from March of 2020, plotted at 1.0636. Yesterday saw the 1.0700 level taken out and that was followed by a pullback to resistance at prior support earlier this morning before another extension of the bearish move.
This bearish move in EUR/USD has been a large component of this continued breakout in the US Dollar as the Euro plays a large role in the composition of the DXY quote.
The bigger challenge here is one of continuation. As looked at last week, prices crawling to fresh lows whilst in a massive zone of support is a point of vulnerability and this can expose pullback potential. The pullback last week was shallow, running up to resistance at 1.0931 as I had looked at ahead of the move.
A similar type of theme may develop in EUR/USD as we close in on that 1.0636 low. On the four hour chart below I’ve added a few possible spots for lower-high resistance potential in blue.
EUR/USD Four-Hour Price Chart
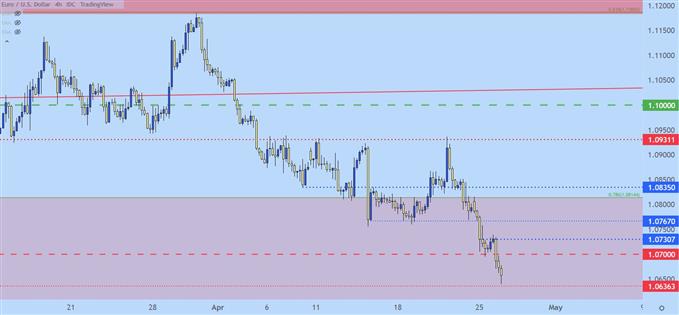
Chart prepared by James Stanley; EURUSD on Tradingview
GBP/USD Crushed After Descending Triangle Break
On the long side of the US Dollar, GBP/USD has been helping with the recent break. I had looked at the pair last week as it was holding the 1.3000 psychological level. There’d already been a couple of tests at that level but nothing that had given way.
The breakout hit here last Thursday and price still hasn’t really stopped moving-lower yet and the move has already covered more than 350 pips in the breakout. The next obvious spot of support potential is down around the 1.2500 psychological level, and that’s confluent with the 61.8% Fibonacci retracement of the 2020-2021 major move.
GBP/USD Daily Price Chart
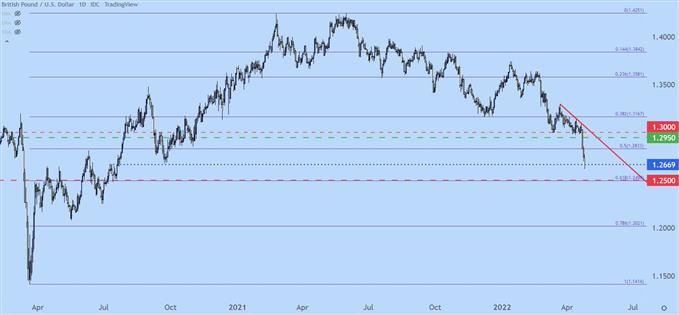
Chart prepared by James Stanley; GBPUSD on Tradingview
Aussie Bears on Attack
Also helping to fuel that topside move in USD has been a return of bears to AUD/USD. During the month of March and into early April AUD/USD remained strong even as the US Dollar was jumping higher. But, as looked at in this week’s forecast the tides have changed over the past two weeks and sellers are back on the prowl.
Already this week price has fallen to a fresh two-month low while finding a bit of support at that level; but the .7000 big figure looks vulnerable here as price has been falling aggressively since that earlier-month high.
AUD/USD Daily Price Chart
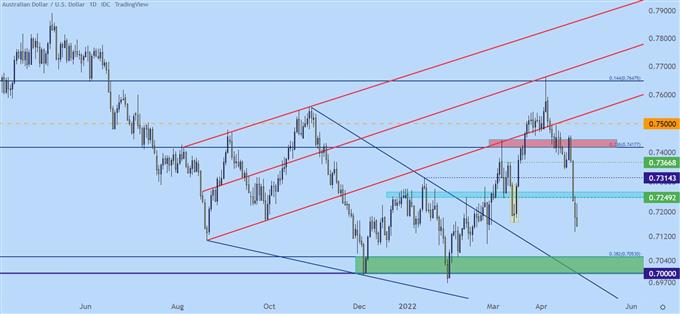
Chart prepared by James Stanley; AUDUSD on Tradingview
USD/JPY Starts to Pull Back
USD/JPY has been in full launch mode since early-March with the trend jumping by more than 1500 pips. And there’s been very little pullback in the move, save for an episode in late-March.
But as price in USD/JPY approached the major psychological level at 130.00, matters started to shift, and now prices have breached a bullish trendline while setting a lower-low.
This gives the appearance of greater pullback potential, with focus on possible supports around 126.55 after which a major zone or prior resistance comes into play. This zone was pulled from the monthly chart at 20-year-highs and spans from 124.15 up to 125.86.
The psychological level at 125.00 remains of interest, as well, as this was the prior point of resistance that brought on a pullback move.
USD/JPY Four-Hour Price Chart
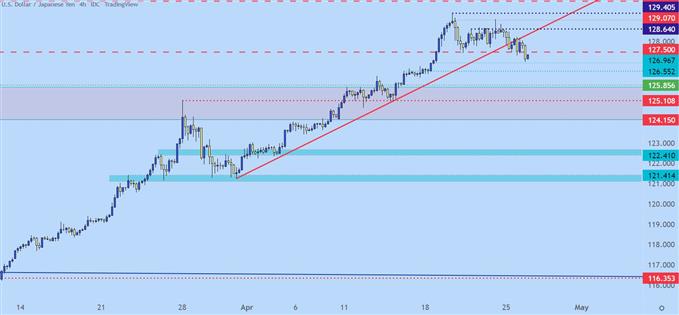
Chart prepared by James Stanley; USDJPY on Tradingview
— Written by James Stanley, Senior Strategist for DailyFX.com
Contact and follow James on Twitter: @JStanleyFX
element inside the
element. This is probably not what you meant to do!Load your application’s JavaScript bundle inside the element instead.
www.dailyfx.com